


Earlier this week, I wrote to you about just how much ground America’s middle class has lost over the past half century, and why so many young Americans are suddenly warming to socialism.
It struck a nerve. Between the comments, notes, and my inbox, I got around seventy responses, with plenty of theories about what caused the decline.
Regulation. Taxes. Offshoring. Green mandates. Two-income households bidding up home prices. Schools failing to teach how a free country works. Politicians deliberately hollowing out the middle class. A generation expecting too much, too soon. “Planned demolition.”
Some of the responses added a lot to the discussion. Others, well... struck me as a little naive.
Take this comment, since deleted:
I think it’s obvious that the younger generation sees that capitalism isn’t the path it once was 50 years ago. The system is horribly corrupt and getting worse. Time for change. They see people living under the Nordic model are happiest in the world. Worth a shot.
I say naive because, having been born in the Union of Soviet Socialist Republics, I’m not convinced that putting “democratic” in front of socialism changes the brutal means required to reach the promised utopia (and no, the Nordic countries aren’t socialist). So, nope. I don't think socialism is “worth a shot.”
But when I reread the comment later, I realized the reader had actually put his finger on something important.
“Capitalism isn’t the path it once was 50 years ago.”
Why 50 years?
Because when you look at what’s happened to the American middle class, that timeframe comes up again and again.
So if we want to understand what caused the decline (and yes, before you wonder, this is very relevant to the investment decisions we make today), going back roughly half a century seems like a pretty good place to start.
Let’s see what America looked like back then.
The America That Was
The post-war era until the 1970s was the golden age of the American middle class. The cost of living was low, economic opportunities were plentiful, and people were friendly.
Now, as I mentioned in my last piece, I obviously didn’t witness that America firsthand. But my grandfather did.
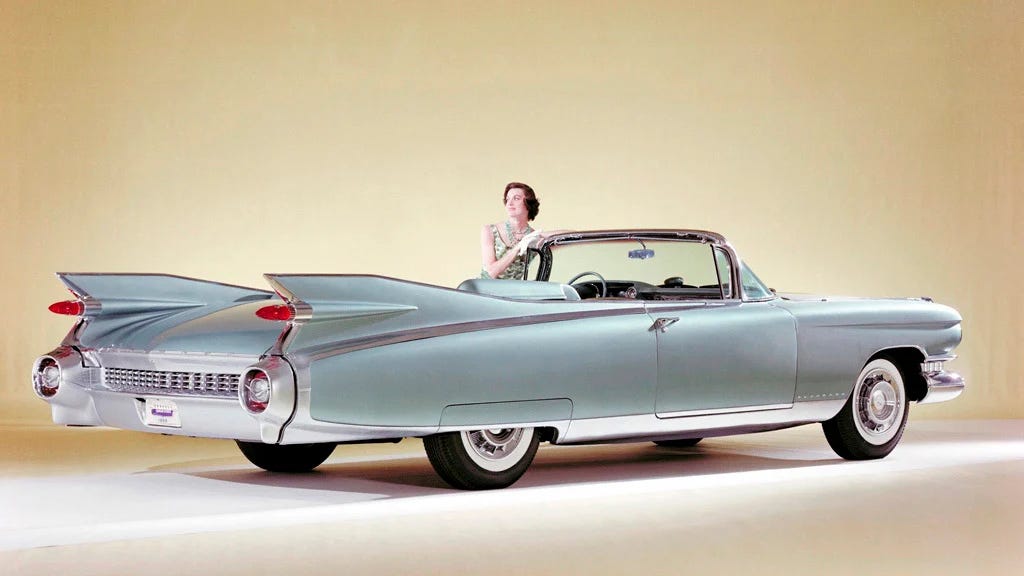
He visited the U.S. for a track and field competition in the 1960s, and for the rest of his life he’d reminisce about the bustling streets, the thriving businesses, and those enormous American cars that made quite an impression on a young man from the Soviet Union. He used to call them “highway ships.”
I also told you about the Zenith portable transistor radio he brought home from that trip. What I didn’t tell you is that bringing a shiny new radio back from the “rotten capitalist West” wasn’t exactly something you did lightly in the Soviet Union.
And that raises an obvious question.
Why take the risk?
Because to my grandfather, it was worth it. American-made goods were coveted everywhere back then. American business was on top, and that “Made in the USA” label was a badge of honor, a guarantee of quality that set the United States apart from anywhere else.
A Zenith radio wasn’t just a radio to a young man from the Soviet Union. It was a little piece of the America he’d seen with his own eyes and never forgotten.
And that America really was on top of the world.
For the average American, that meant a pretty straightforward path to success: work hard, make more money, and move up in life.
Take a look at the next chart. It shows how wages, adjusted for inflation, and productivity rose side by side during the heyday of the American middle class. The harder you worked, the more you earned. It was the key to social and income mobility. And it nurtured a healthy middle class.
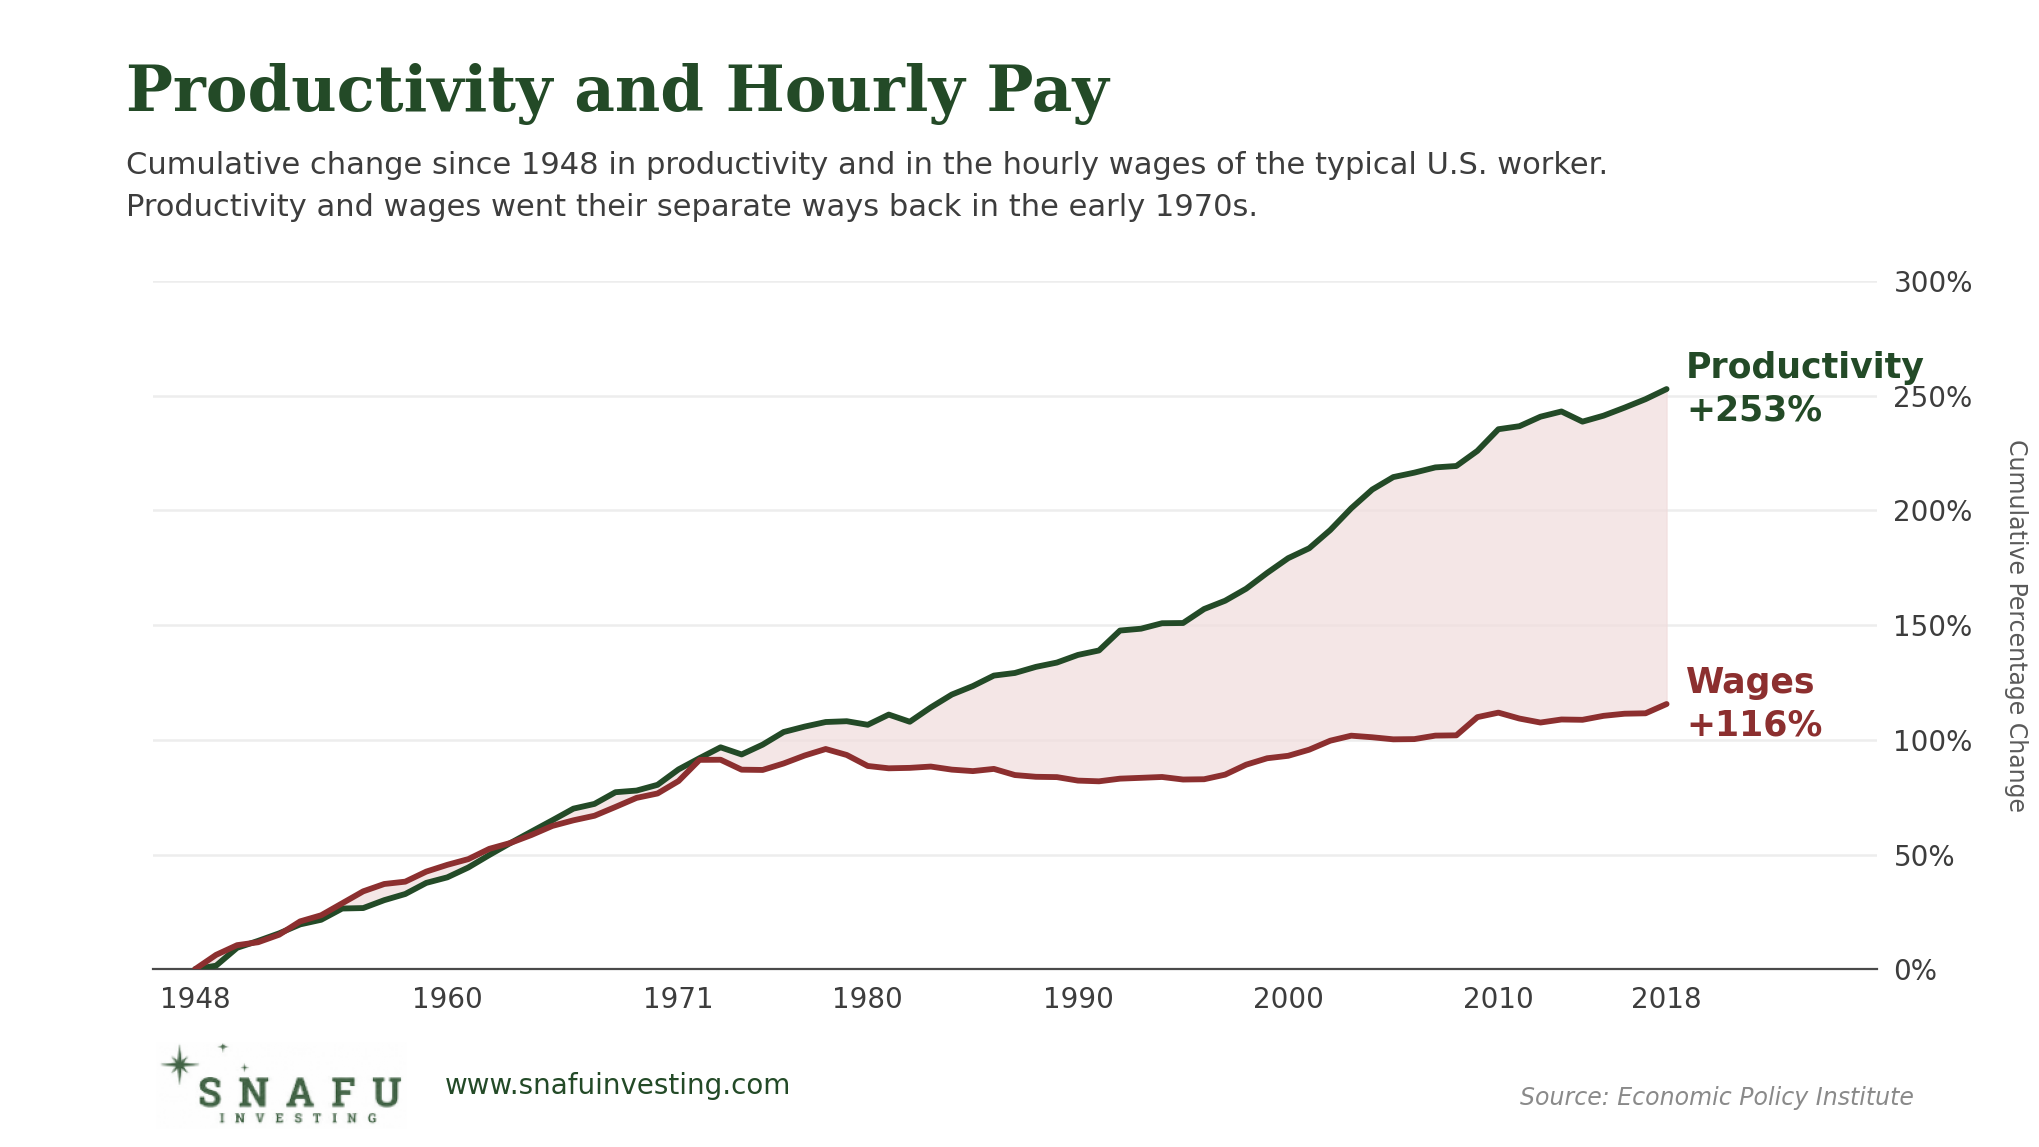
But then something weird happened in the early 1970s. Work and wages began to split apart. As the chart clearly shows, productivity kept climbing, while the real wages of the average worker essentially stagnated. And over the decades that followed, the gap only grew wider.
And here’s an even more dramatic way of looking at the same process.
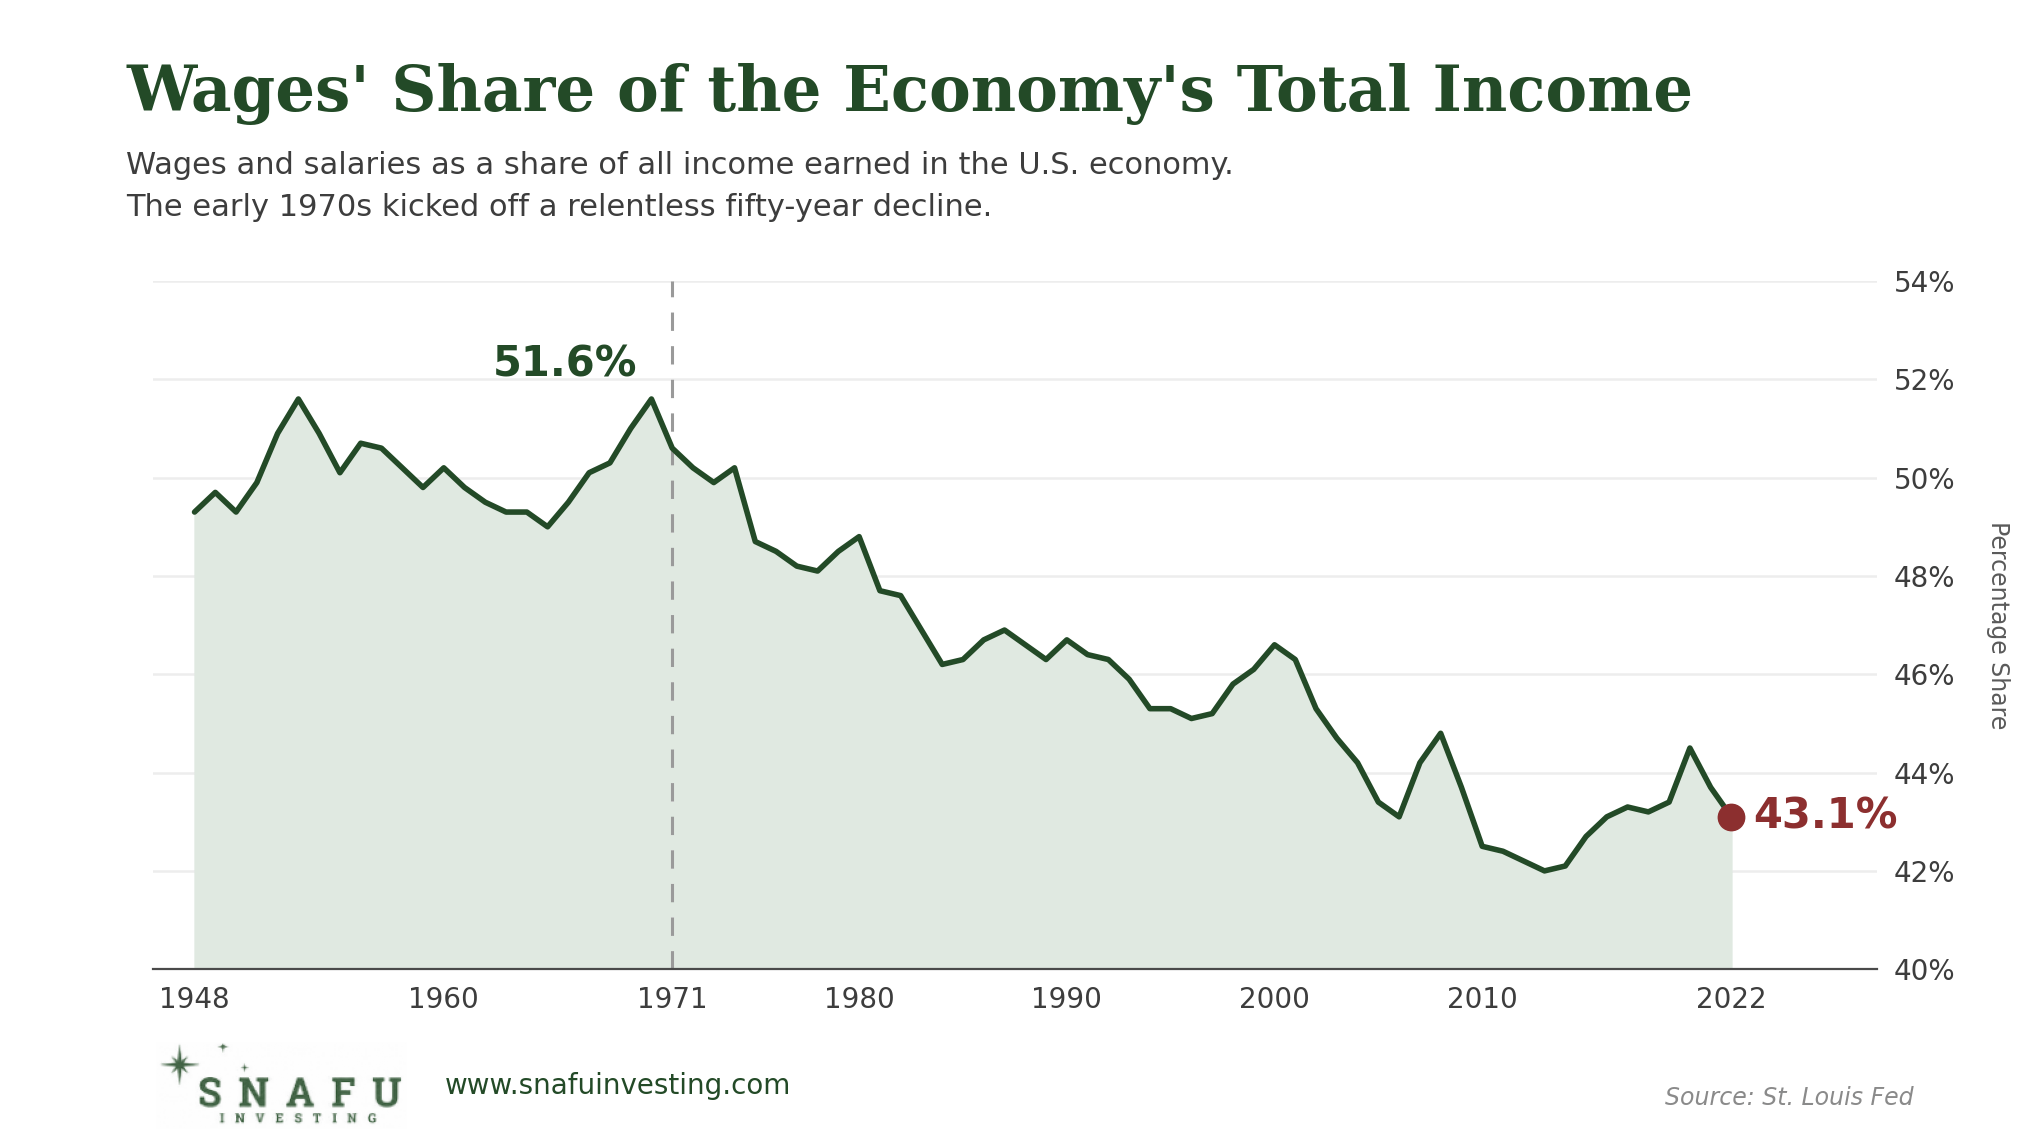
Since the 1970s, wages have been getting a smaller slice of the income pie in the U.S. economy. Back in 1970, they made up about 52% of the total. By 2022 that had dropped to 43%. That’s a 17% decline.
So while the economy has been growing overall, wages haven’t been keeping up.
And here’s one more graph you might find intriguing.
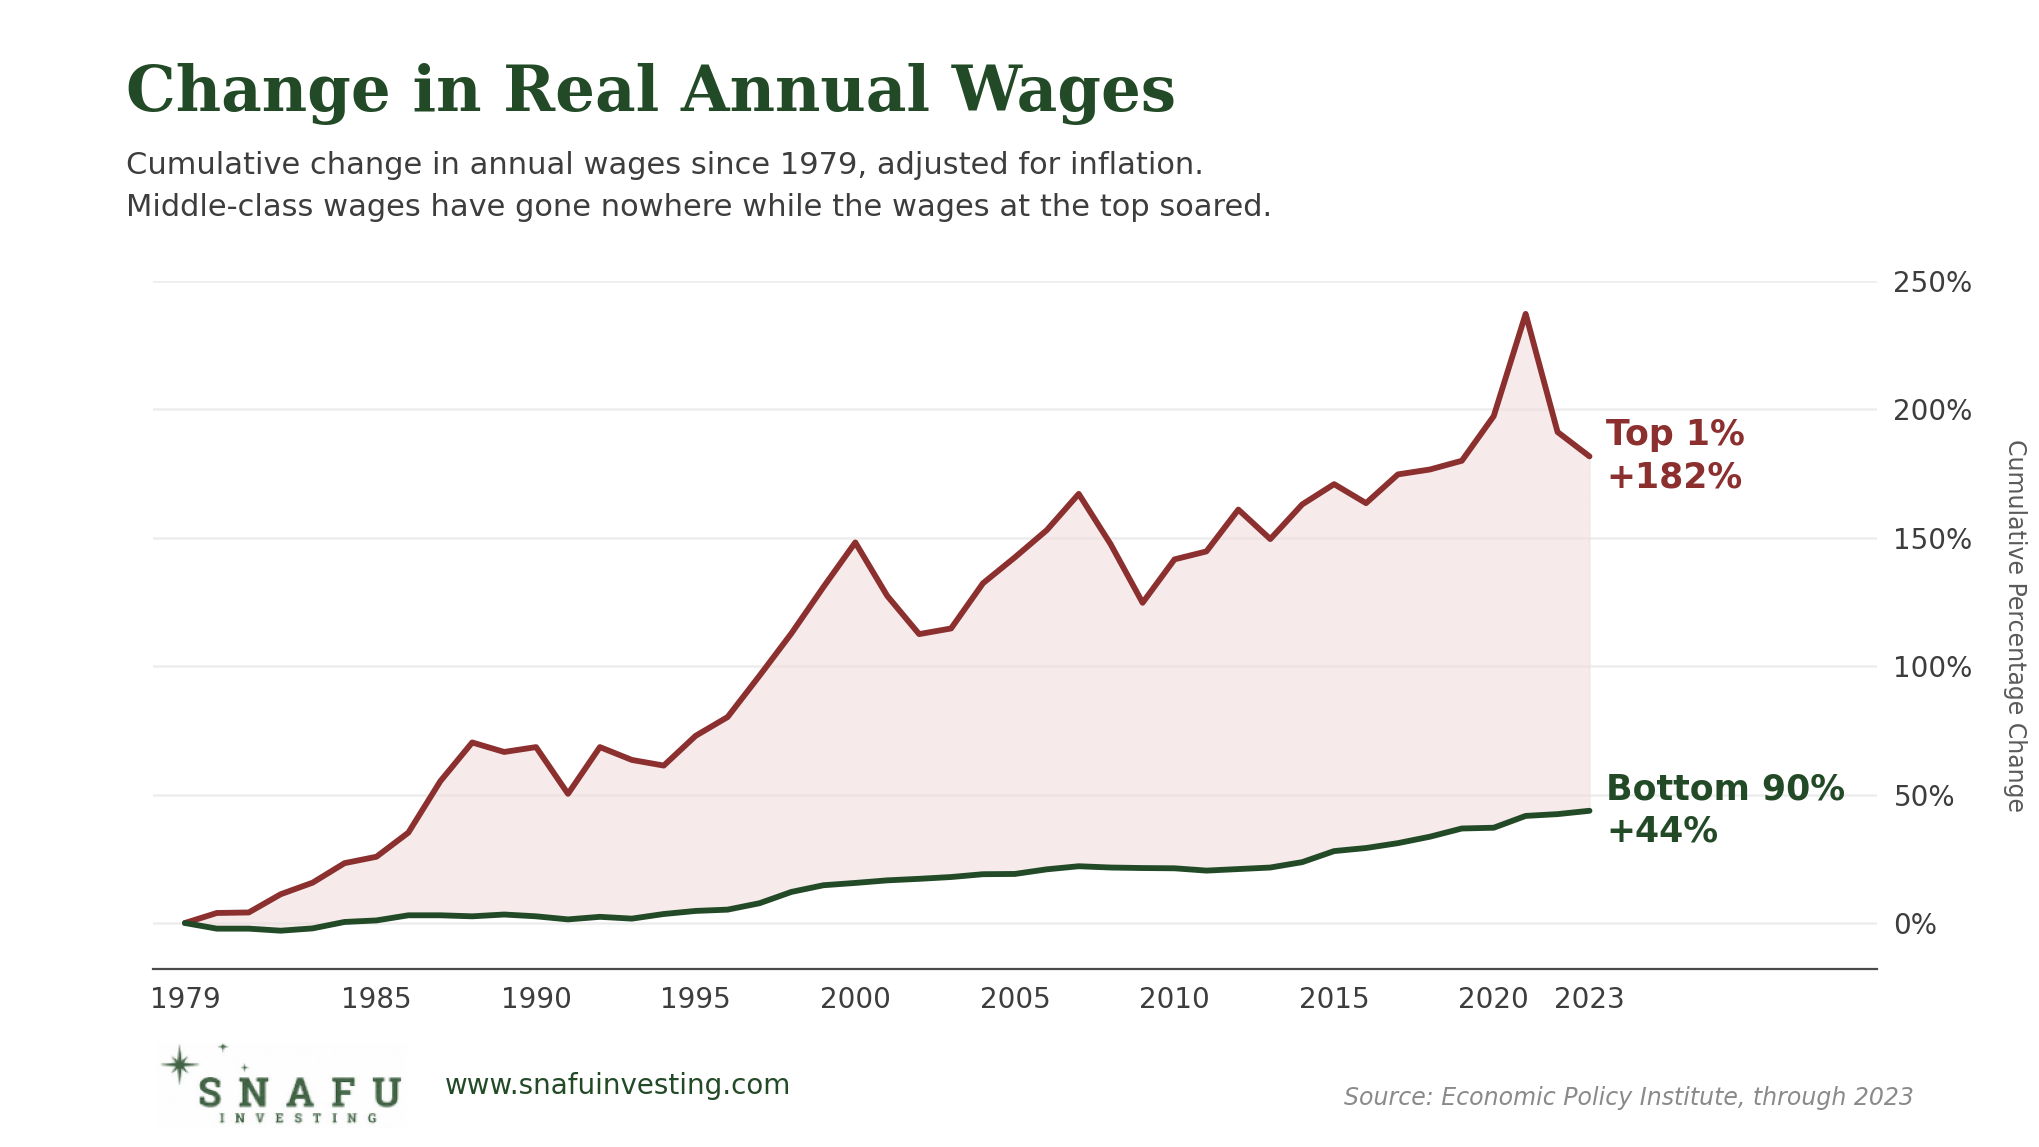
As you can see, wages for the top 1% have grown 182% since 1979. For the bottom 90%, just 44%. Quite the difference.
To be clear, inequality itself isn’t the problem here. As the economist Thomas Sowell once wrote, “Nobody is equal to anybody. Even the same man is not equal to himself on different days.”
The issue is that this inequality wasn’t what you’d call natural. Sure, you might expect the wages of the top 1% to grow faster than those of the bottom 90%. But more than four times faster? That suggests something else was going on.
What Happened in 1971
Now, you’ve probably noticed that all the charts above have one thing in common: things start going downhill in the 1970s.
That’s no coincidence.
In 1971 — or more precisely, on the evening of Sunday, August 15, 1971 — the U.S. government made a historic move that set off the gradual extinction of the middle class. In terms of its consequences, it belongs alongside the 1929 crash, JFK’s assassination, and 9/11. Yet most people know nothing about it.
This is the date President Nixon killed the last remnants of the gold standard.
I say “remnants” because the U.S. had already left the gold standard for domestic purposes back in 1933. Americans couldn’t redeem dollars for gold. But under the post-war monetary system, foreign governments and central banks still could. Narrow as it was, it was the last real discipline against unlimited borrowing and spending.
It also allowed the U.S. to rebuild the global monetary system around the dollar, leveraging its victory in the war and its position as holder of the largest gold reserves on earth.
The new system, created at the Bretton Woods Conference in 1944, tied almost every nation’s currency to the U.S. dollar at a fixed rate. It also tethered the dollar to gold at $35 an ounce.
This arrangement made the dollar the world’s premier reserve currency, effectively forcing other countries to hold dollars for trade or redeem them with the U.S. for gold.
But by the late 1960s, spending on welfare and the Vietnam War (and printing money to cover the difference) had pumped far more dollars into circulation than there was gold to back them.
Other countries weren’t thrilled about holding all those dollars, so they started cashing them in. America’s gold stock drained from roughly 700 million ounces at its peak to around 290 million by 1971.
To plug the drain, Nixon “suspended” the dollar’s convertibility into gold. This ended the Bretton Woods system and severed the dollar’s last tie to gold.
The next chart paints a picture of what came next.
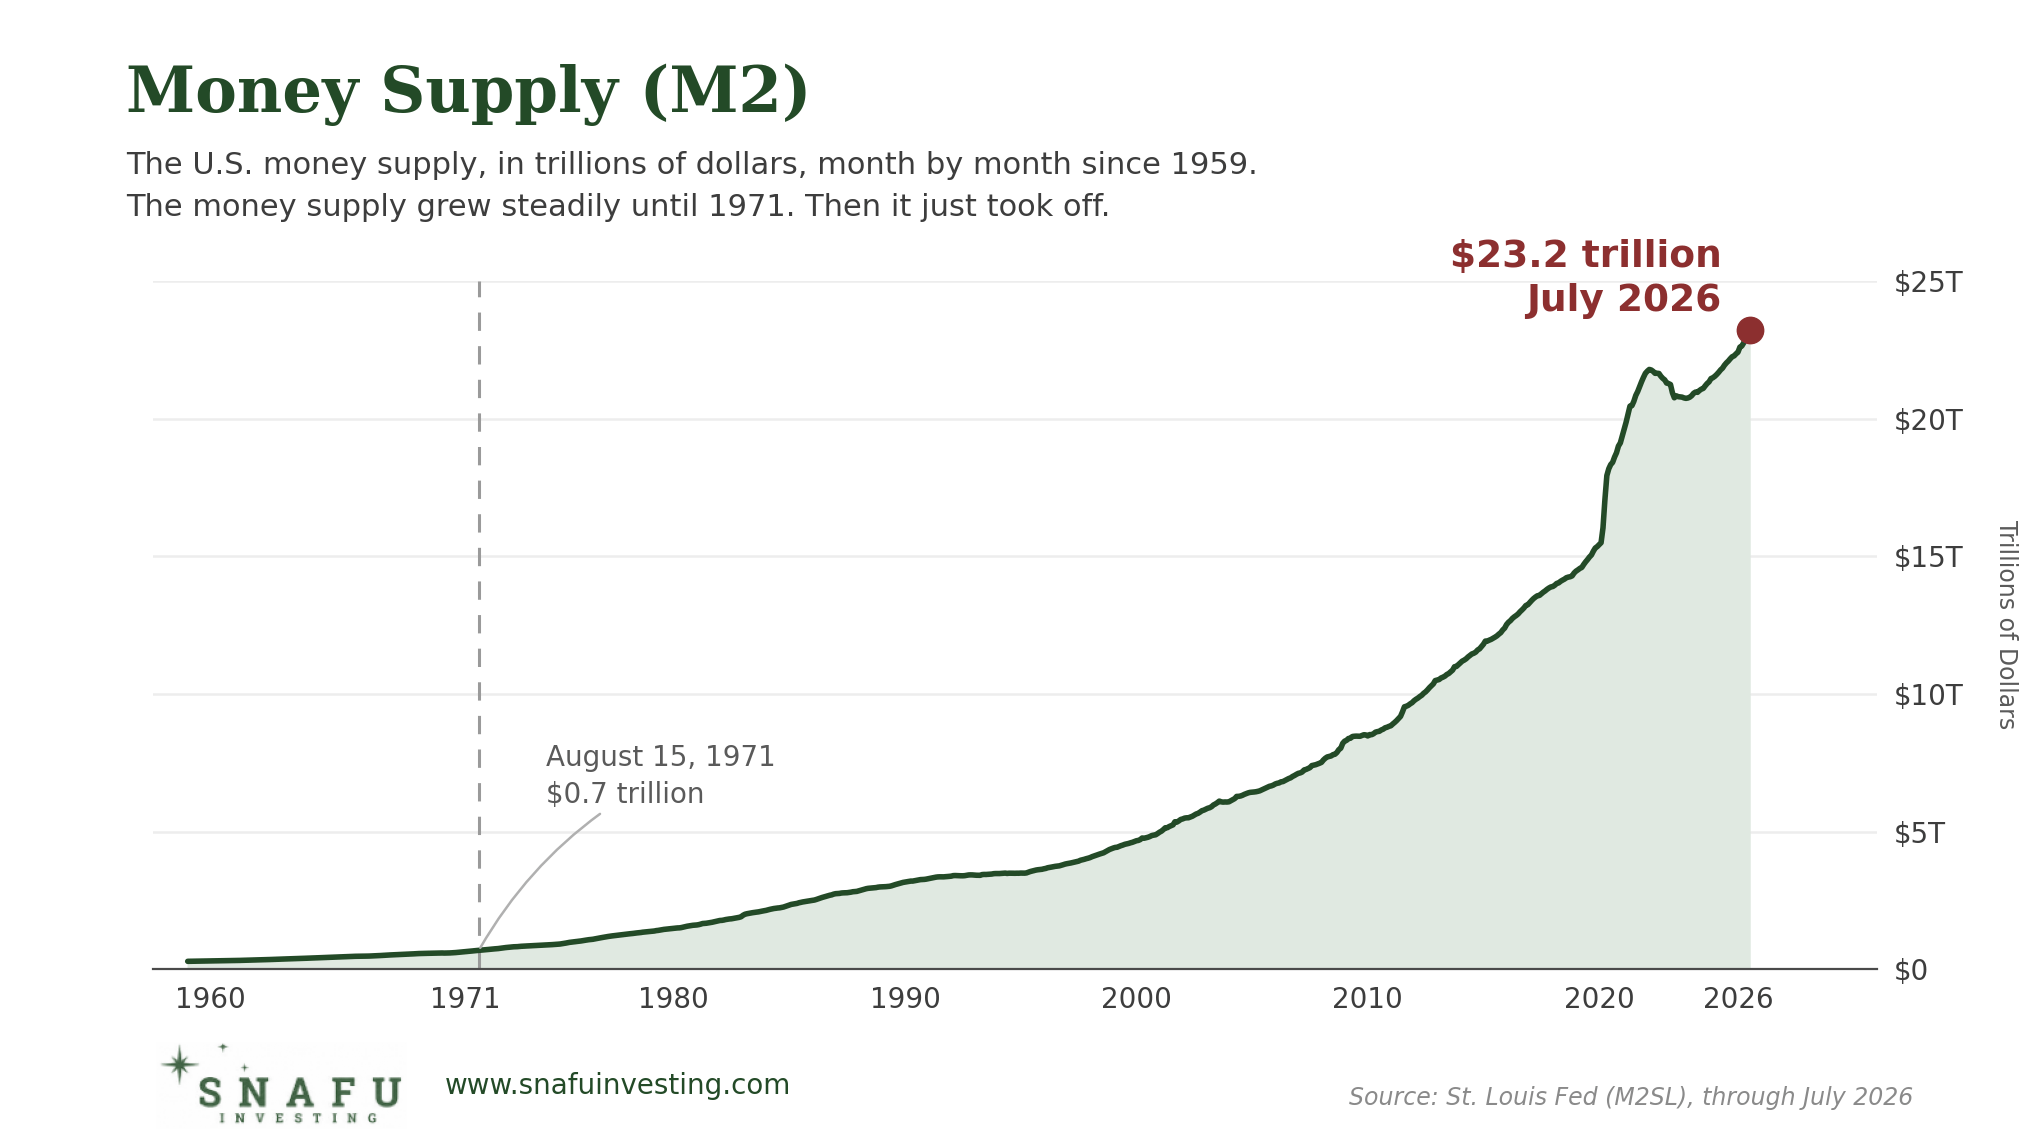
As you can see, the U.S. money supply took off after the early 1970s. When Nixon closed the gold window in August 1971, M2 stood at just $0.7 trillion. Today, it’s $23.2 trillion, more than 30 times as much.
And anyone with a basic grasp of economics knows what happens when you create more and more units of a currency. Each one buys less. Prices rise. That’s the actual definition of inflation: an increase in the money supply.
So I’m sure you can see where I’m going with this. Which is to ask: What happened to the dollar’s purchasing power once it was fully untethered from gold?
Well, the basket of goods and services used to calculate consumer price inflation that cost 41 cents in August 1971 cost 92 cents by August 1981. In other words, the dollar lost 56% of its purchasing power.
Think about that. More than half, gone inside a decade.
So much for “gradual” devaluation.
And, of course, it didn’t stop there. Today, the dollar has lost roughly 90% of the purchasing power it had in the early 1970s.
Everything, All at Once
Curiously, the upheaval that began in the 1970s had ripple effects far beyond just money and the economy. Almost every aspect of American life seems to have taken a turn for the worse. Incarceration rates, divorce rates, out-of-wedlock births, the sheer volume of laws on the books, the size of the government itself. All of them surged in the decades after 1971.
Or take something all of us have to deal with throughout our lives: healthcare.
The chart below shows total national health spending over the past six decades. As you can see, it went from just $27 billion in 1960 to around $4.1 trillion in 2020.
That’s a 152-fold increase.
Astonishing.
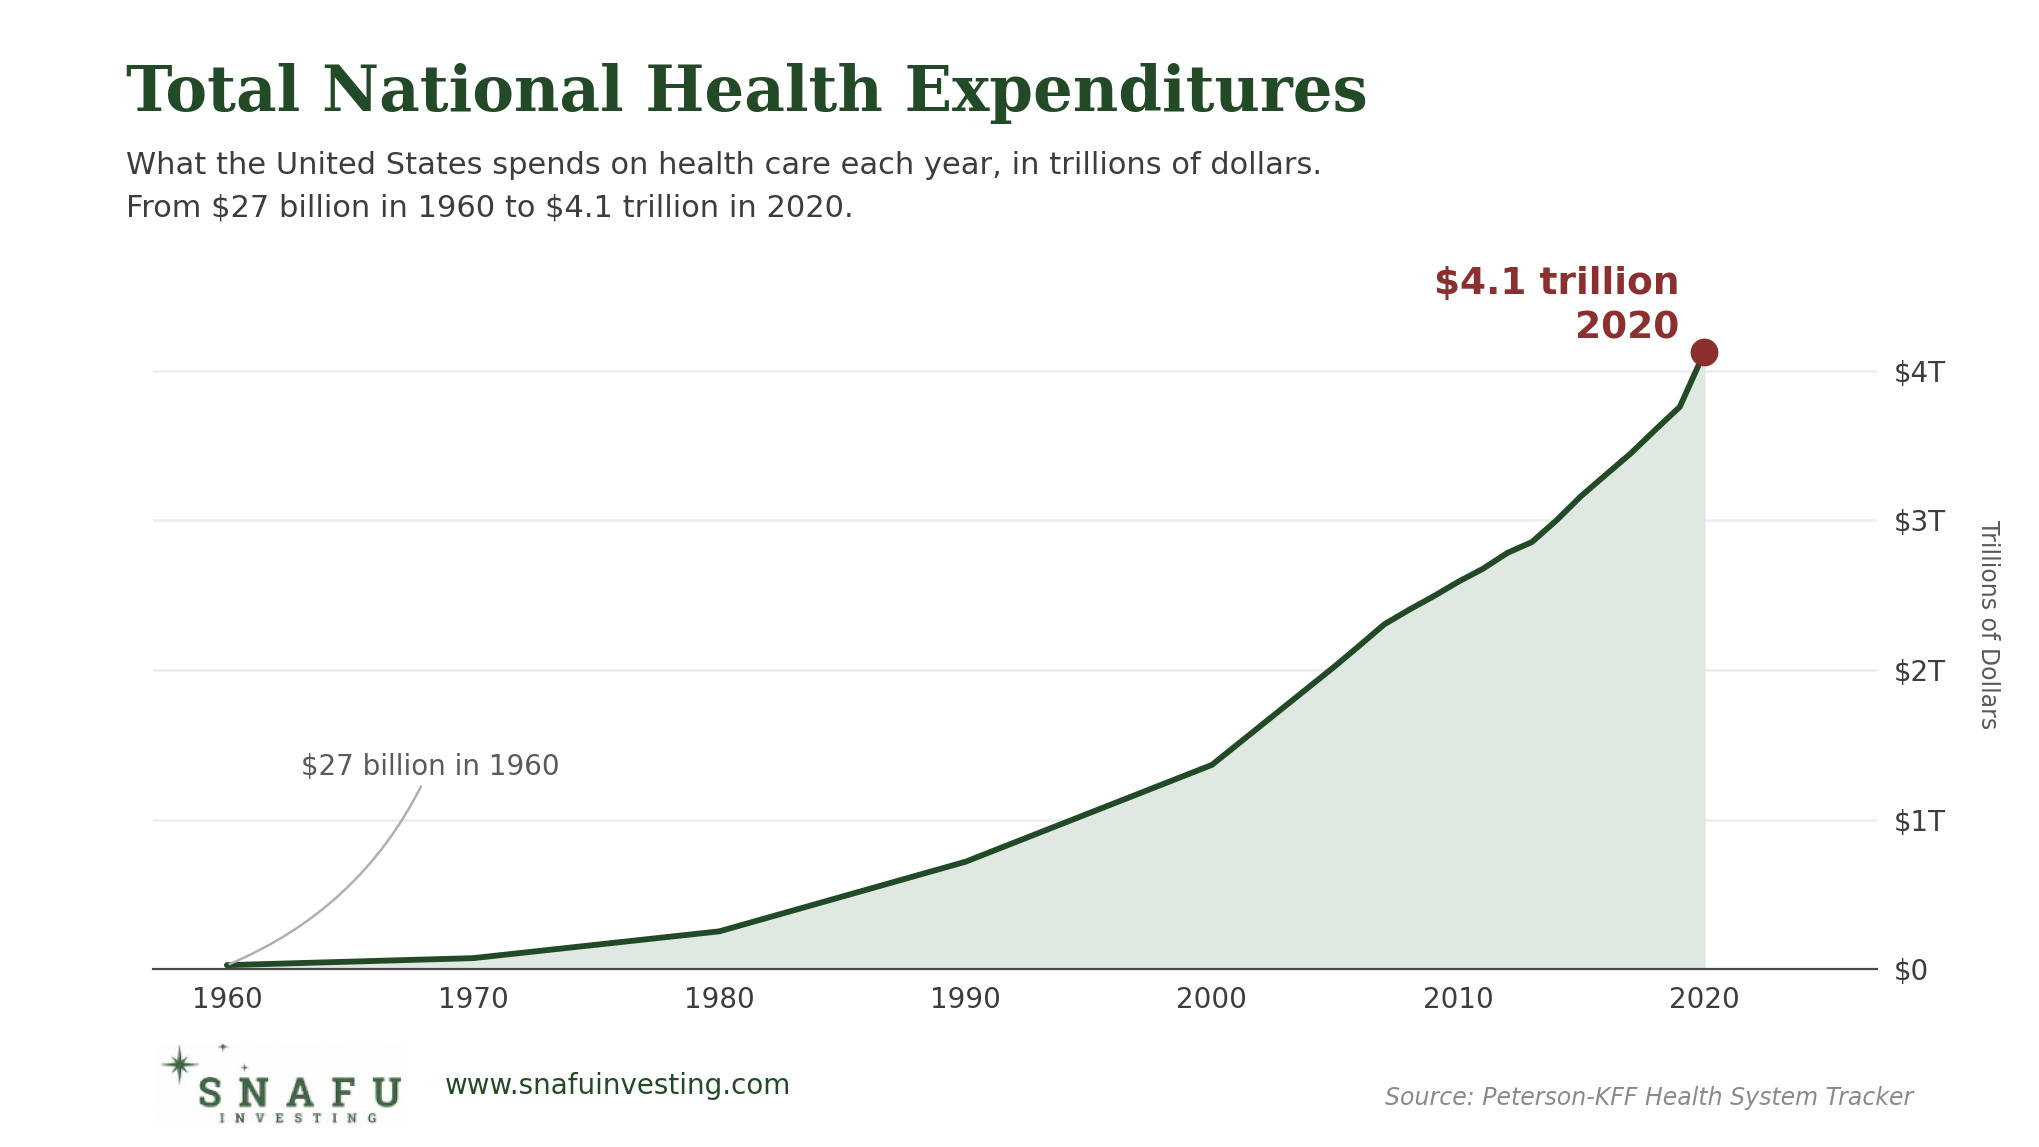
Now, before anyone in the comments says, “Yeah, but the country was much smaller back then,” even after adjusting for population growth, from 181 million Americans in 1960 to 331 million in 2020, healthcare spending still rose roughly 83-fold per person.
For Pete’s sake, even after adjusting for inflation, you’re still looking at roughly a tenfold increase in real healthcare spending per person. And inflation, again, is of course itself downstream of the monetary change we’ve been talking about.
There are plenty more hair-raising charts I could throw your way, enough to make you want to hurl your device across the room. But the point is, they would all drive home the same message.
When you break the underlying measure of value, everything starts to unravel.
That, as far as I’m concerned, is the biggest SNAFU of our time (the one that made so many of the others possible, from healthcare to wars and everything in between).
Situation normal. Position accordingly.
Enjoy the rest of your weekend,
Lau Vegys
P.S. Gold may not be money in the official sense anymore. But it remains money in the eyes of the market. So a good way to protect yourself from the continued erosion of your purchasing power is to convert as much government currency as you can into real money. That’s the first step. Then, for potentially greater profits, there are gold stocks, which give you leverage to the gold price. That’s why SNAFU Investing’s first monthly issue, which went out to paid subscribers recently, featured a fresh gold pick. If you’re a paid subscriber, make sure it didn’t land in your spam folder. If you’re not, the intro is free to everyone.
I began my work career in 1971, making $600 a month. Not much, but liveable. I got my Master's degree in August 1973 and got a raise to $900 a month. Through the years I realized it kept getting harder and harder to get ahead. I remember seeing an ad in the paper in 1973 for a new Porsche 911 for $8,000--less than 75% of my annual salary. Gradually, despite job changes and raises, that Porsche was never that cheap again. Nor was housing. When I retired in 2020, I was making $110,000. But I can see, as I knew all along, that the most money I ever made was that $900 a month in 1973. Sad! But it's even sadder for young people today.
The effects of fiat money are the reason for much of the wild societal effects. Divorce, stress, violence, poverty are all on display. Sound money would fix so much of this. Hopefully the citizens figure this out through writings like this and put THEMSELVES on a gold/silver standard