


The S&P 500 set another record yesterday.

It did so with oil above US$100, the 10-year Treasury yielding 5.2%, a US$2.1 trillion deficit fresh off the press, and AI companies that have yet to post a profitable year lining up US$2 trillion IPOs.
With all that going on, and plenty more I haven’t mentioned, you’d expect at least a good wobble. Instead, this:
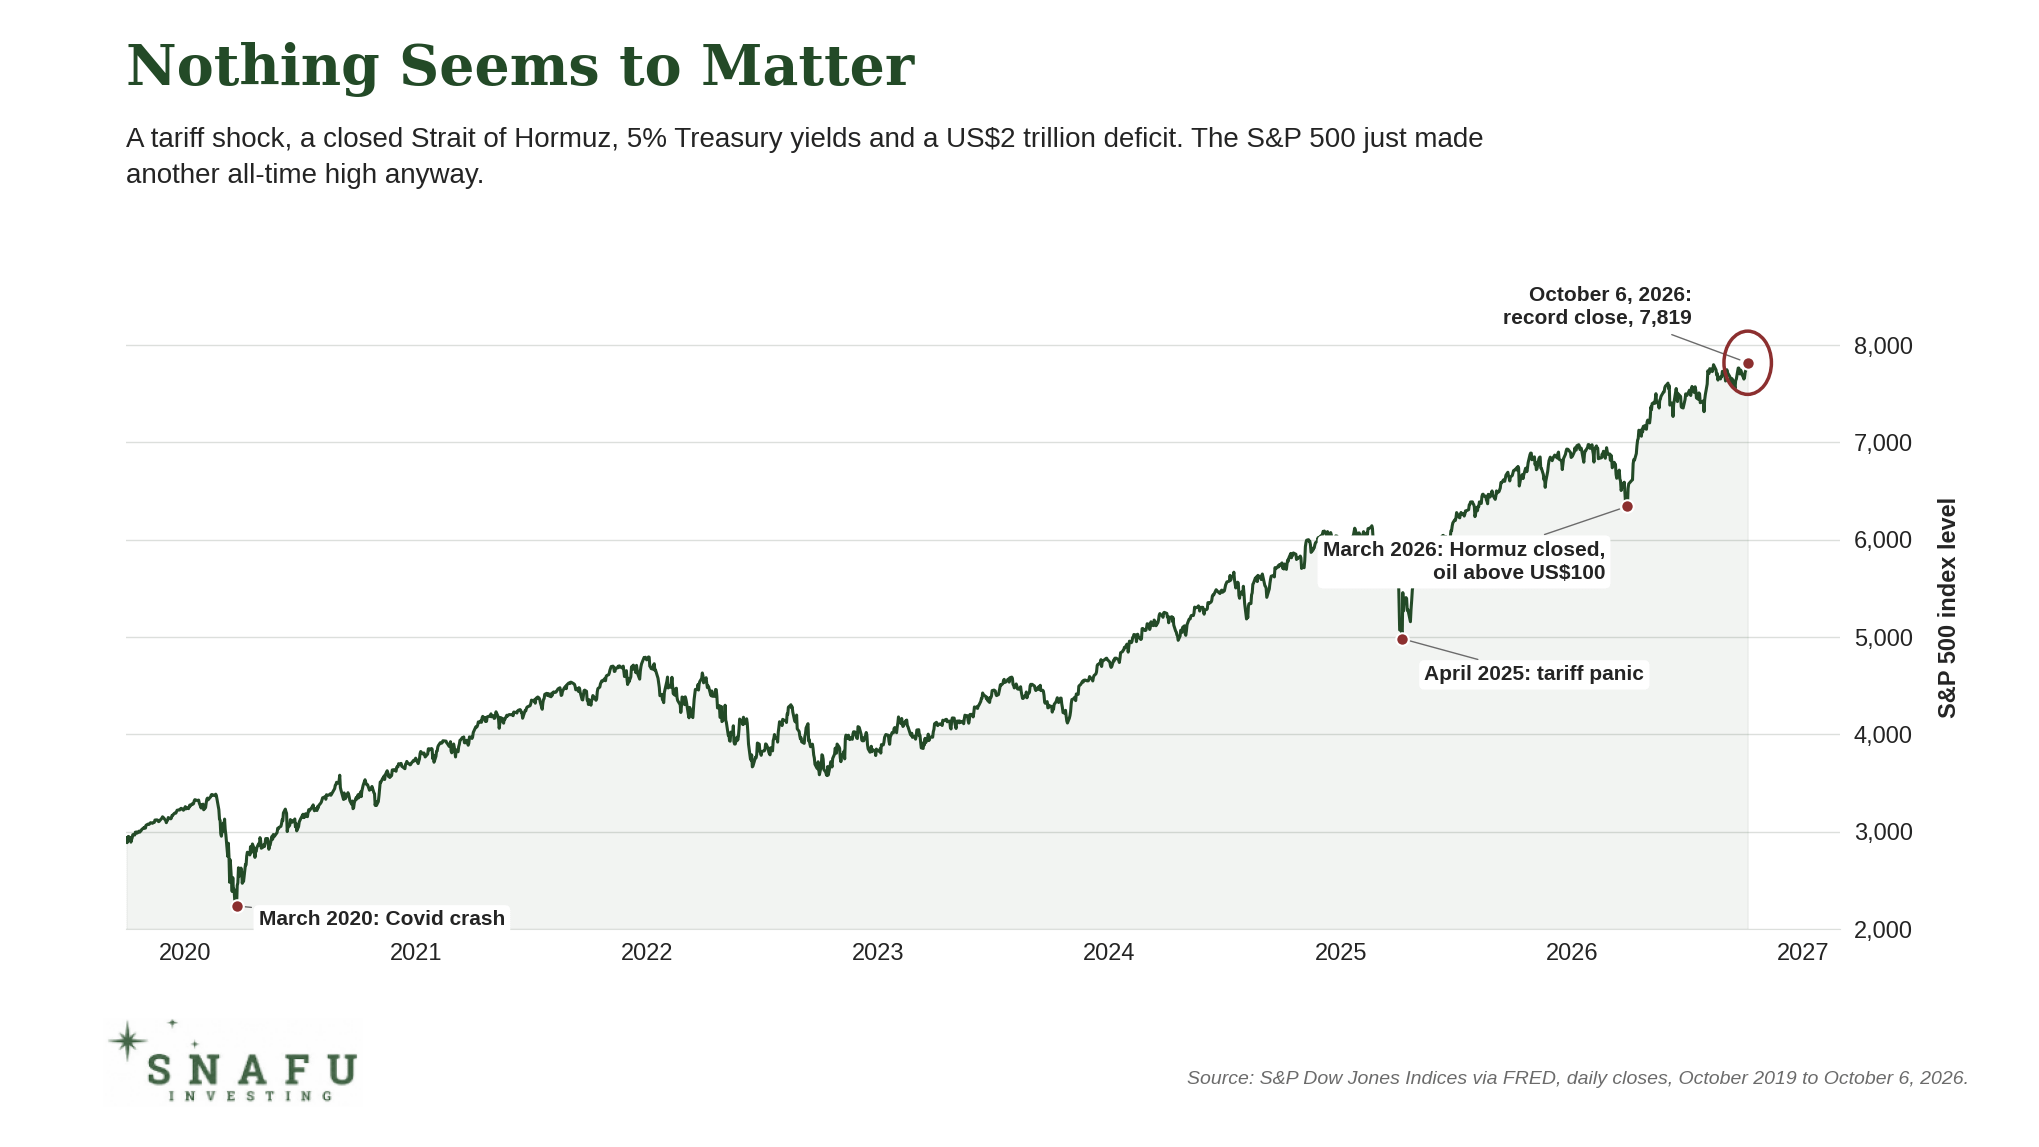
Now, I’m not going to pretend I know when that changes. What I can do is show you just how far from normal things have drifted, because I don’t think most people realize it.
There’s a measure called the CAPE, the cyclically adjusted price-to-earnings ratio. Unlike the regular P/E, which just looks at the last twelve months of earnings, the CAPE smooths out a full decade of data to cut through the noise. It’s the closest thing we have to a reliable gauge of whether the stock market is cheap or expensive relative to what companies actually earn over time. It was built by Yale’s Robert Shiller, who won a Nobel for his work on asset bubbles, which tells you what it was built to catch.
Right now, the CAPE is sitting at 41.9. Take a look.
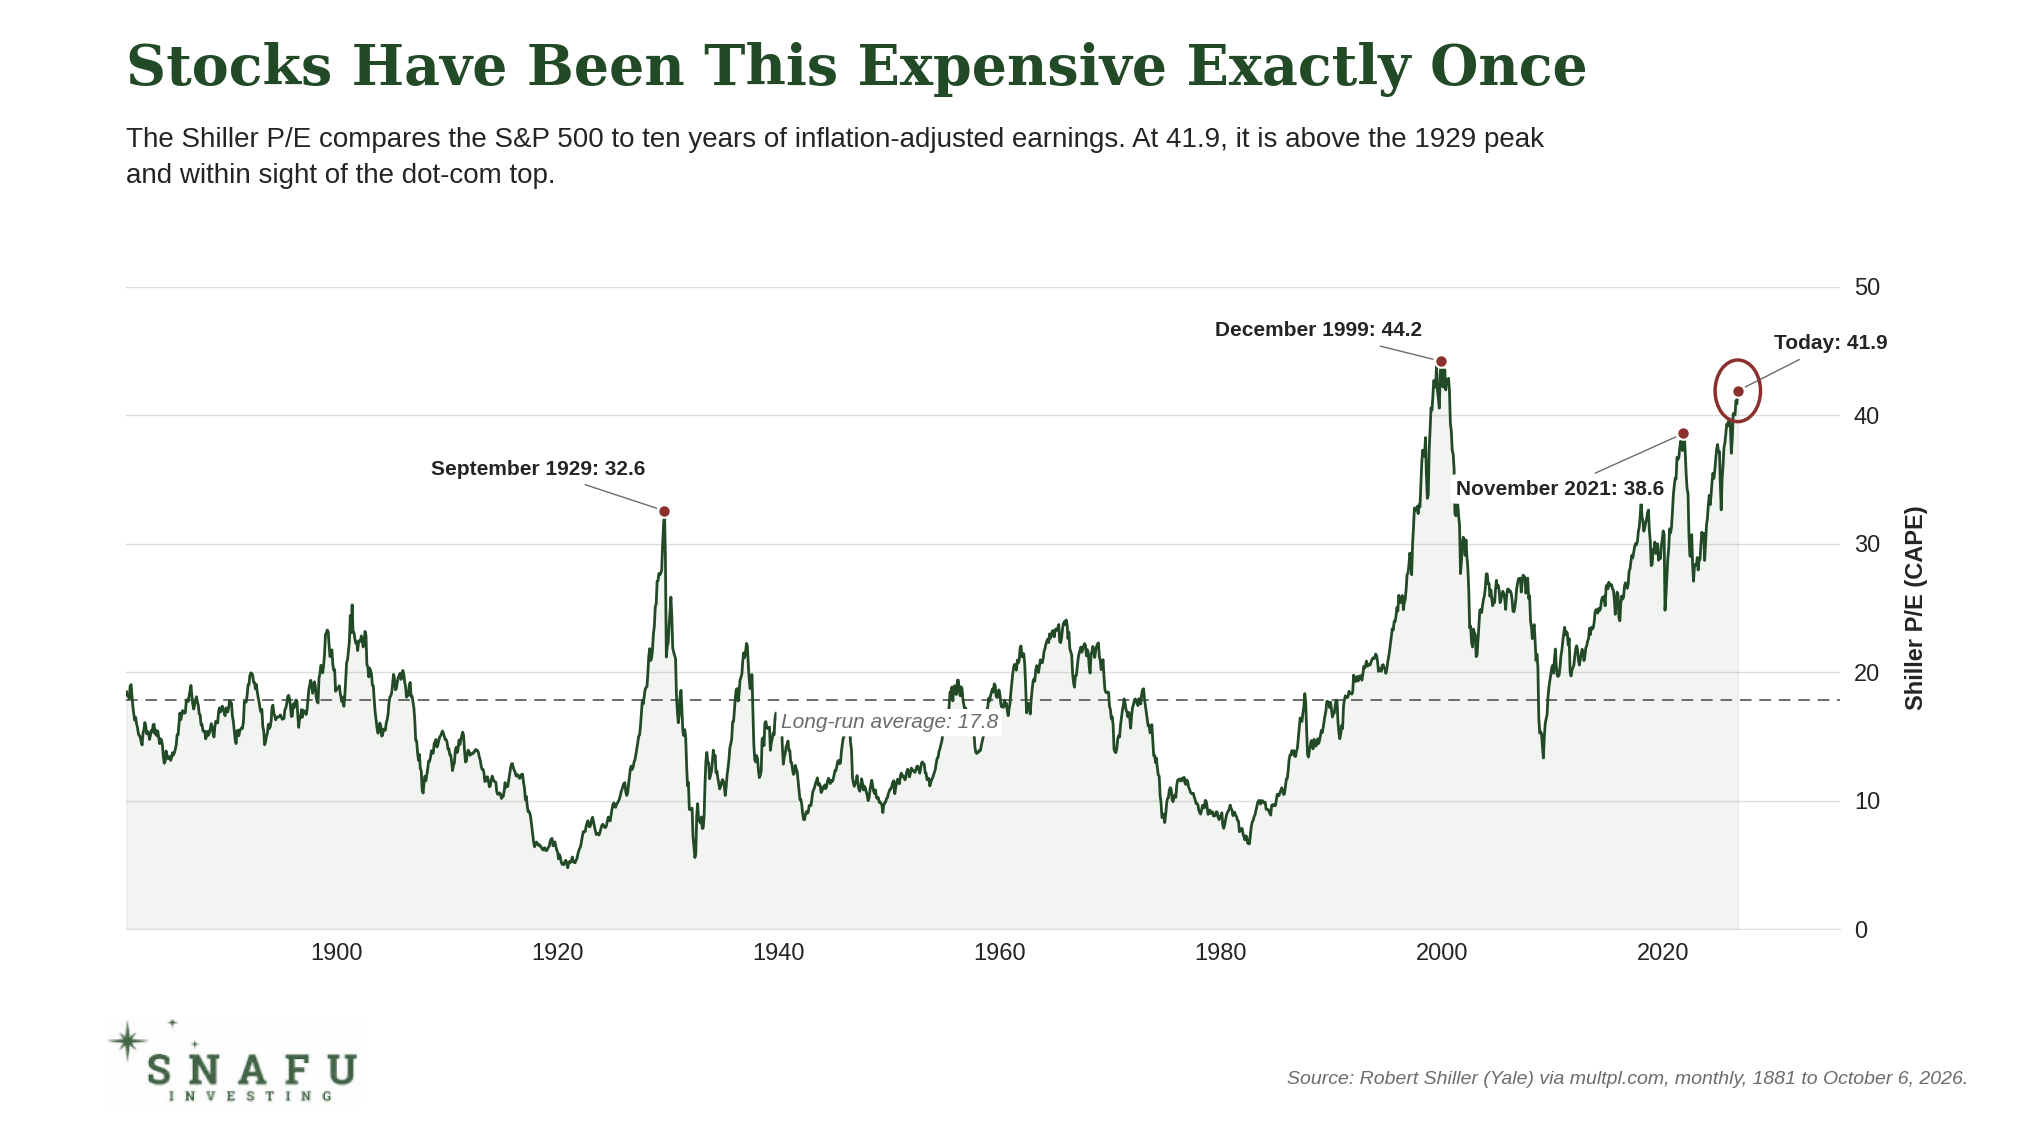
That’s the second-highest reading this measure has ever recorded. The only time in history it was higher? The dot-com peak of 1999, right before the Nasdaq lost nearly 80% of its value. And yes, amazingly, today’s number is well above where it stood on the eve of the 1929 crash.
Could it keep climbing to the dot-com high of 44? Maybe. Stranger things have happened. But the long-run average is about 18, and the market always goes back there eventually. For that to happen, one of two things has to give: either S&P 500 companies more than double their earnings, or prices come down. I have to say, the first option feels a lot less likely than the second, especially with borrowing costs climbing all year.
Ten Stocks and a Prayer
Now, you might be thinking: “Markets have been expensive before and done just fine.” Sometimes, yes. But here’s the thing: this market is not 1999. The valuation looks similar on paper. Underneath, the structure is far more fragile.
Think about it this way. The top ten stocks in the S&P 500 now account for roughly 40% of the entire index. At the dot-com peak, that number was around 26%. The index has never been this top-heavy.
Those ten, by the way, are Nvidia, Apple, Microsoft, Alphabet, Amazon, Broadcom, Meta, Micron, Tesla and AMD. Most of them reported record revenue last quarter. But here’s the thing.
Apple and Tesla aside, the other eight are engaged in what you might politely call a circular arrangement. Four of them, Nvidia, Broadcom, Micron and AMD, sell AI chips. The other four, Microsoft, Alphabet, Amazon and Meta, buy them. So the record revenues on one side of the index are the record spending on the other.
That spending, of course, is what the chipmakers’ share prices rest on, and those share prices are what’s been pulling the index to new highs, which is what convinces everyone the spending must be working.
But it goes further than that. Nvidia, for instance, put US$30 billion into OpenAI earlier this year, and OpenAI is spending most of what it raises on computing power, much of it Nvidia’s. AMD has promised OpenAI and Meta up to 160 million shares each, at a penny apiece, which at today’s share price is a gift of around US$100 billion to each of them, in return for buying its chips.

In short, money goes out the front door and comes back in through the side.
There’s an old story about a town where everyone took in each other’s laundry. The money went round and round, and everyone got rich. It’s usually told as a joke about bubbles. Right now it’s a fair description of 40% of the S&P 500.
So when you buy “the S&P 500” today, you’re not buying 500 companies. You’re making a very concentrated bet on a handful of names. The diversification you think you’re getting is largely an illusion.
And you know what’s holding that handful together?
One thing: the bet that AI spending pays off. Tech companies are on track to pour over US$700 billion into AI infrastructure this year. And that’s precisely the problem, because so far, there’s almost nothing on the other side of the ledger. Consumers worldwide spend about US$40 billion a year on AI services, and that’s after the figure tripled this year. Numbers that far apart are hard to picture, so here they are side by side.
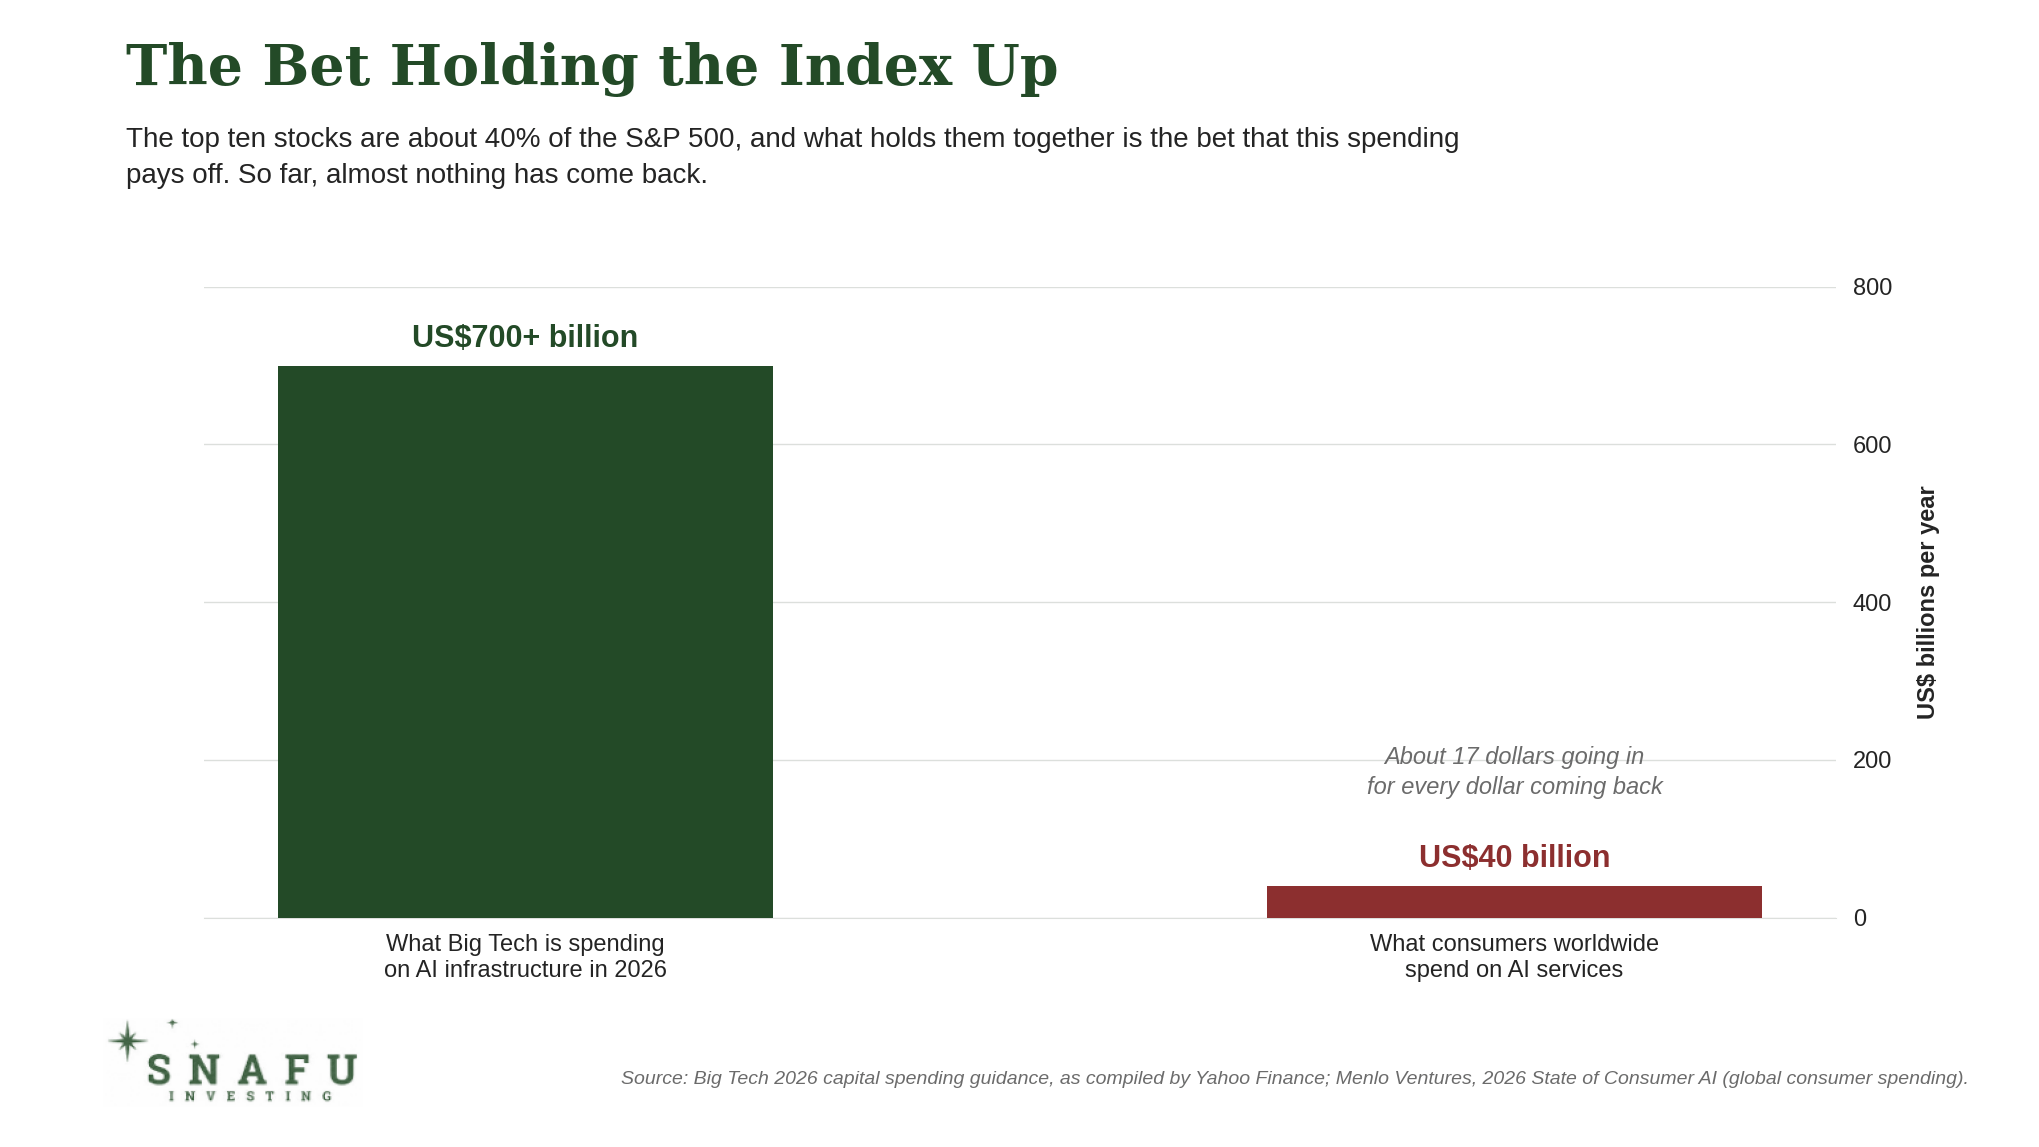
US$700 billion going in. US$40 billion coming back.
Incidentally, that mismatch between what’s being spent and what’s being earned is the exact same dynamic that played out during the fiber optic buildout of the late 1990s. Telecom companies spent hundreds of billions laying cable for an internet economy that was real, but that took far longer to monetize than anyone expected. The infrastructure survived. The investors who bought the peak did not.
Now, none of this means AI is fake, or that it won’t eventually reshape entire industries. It probably will. But “eventually” is doing a lot of heavy lifting when you’re spending US$700 billion a year on a bet that hasn’t come close to paying for itself yet.
Remember, the late 1990s internet was real too. The money just showed up a decade before the revenue did.
The Bottom Line
So when someone asks me why the S&P 500 hasn’t cracked yet, my answer is: barring a government rescue in some shape or form, give it a bit of time.
That goes double right now, with oil in three digits and Treasury yields at two-decade highs. Neither of those shows up in the stock market the week it happens. An oil shock can take six months or longer to reach the earnings calls, when companies start guiding down and margins start compressing. Expensive money takes even longer, but it gets there too, because every one of those AI budgets was drawn up when borrowing was cheap, and now has to be financed at a price nobody modeled.
We’ve seen this movie before, too.
The S&P 500 peaked in October 2007 and spent months drifting sideways while the subprime market was already on fire underneath it. Everything looked fine, until it didn’t. By the time equities caught up to reality, Lehman was gone, and before the dust settled the index had been cut in half.
My point is, the market will figure this out. It always does. Just probably not the moment you expect it to.
Regards,
Lau Vegys
P.S. The SNAFU Investing portfolio owns none of this. No index funds, no Magnificent Seven, no AI capex story. What it owns is the stuff the index has almost no exposure to: real assets nobody can print, and the companies that own them in the ground, some of which are still trading below our buy-up-to prices. The latest monthly issue went out just recently with a brand-new recommendation: an American rare earth producer, uniquely positioned for the U.S.-China standoff. If you’re a paid subscriber, make sure you haven’t missed it. If you’re not, now might be a good time to see what you’ve been passing up.
At this point, all i can say is "you da' man!
thank you,
DFH
I think CAPE may actually understate how extreme current valuations are. The unusually large fiscal deficit is supporting corporate profits and profit margins through the Kalecki-Levy mechanism, which mechanically boosts the “E” in valuation ratios. If you instead look at total market cap relative to GDP, which is less affected by elevated profit margins, today's valuation is meaningfully above the 2000 peak. So the comparison with 1999 may actually be too generous to today's market.