


If you needed any more evidence of just how far gone the U.S. government’s finances are, look no further than the Treasury’s own latest projections.
You may have already seen the headlines.
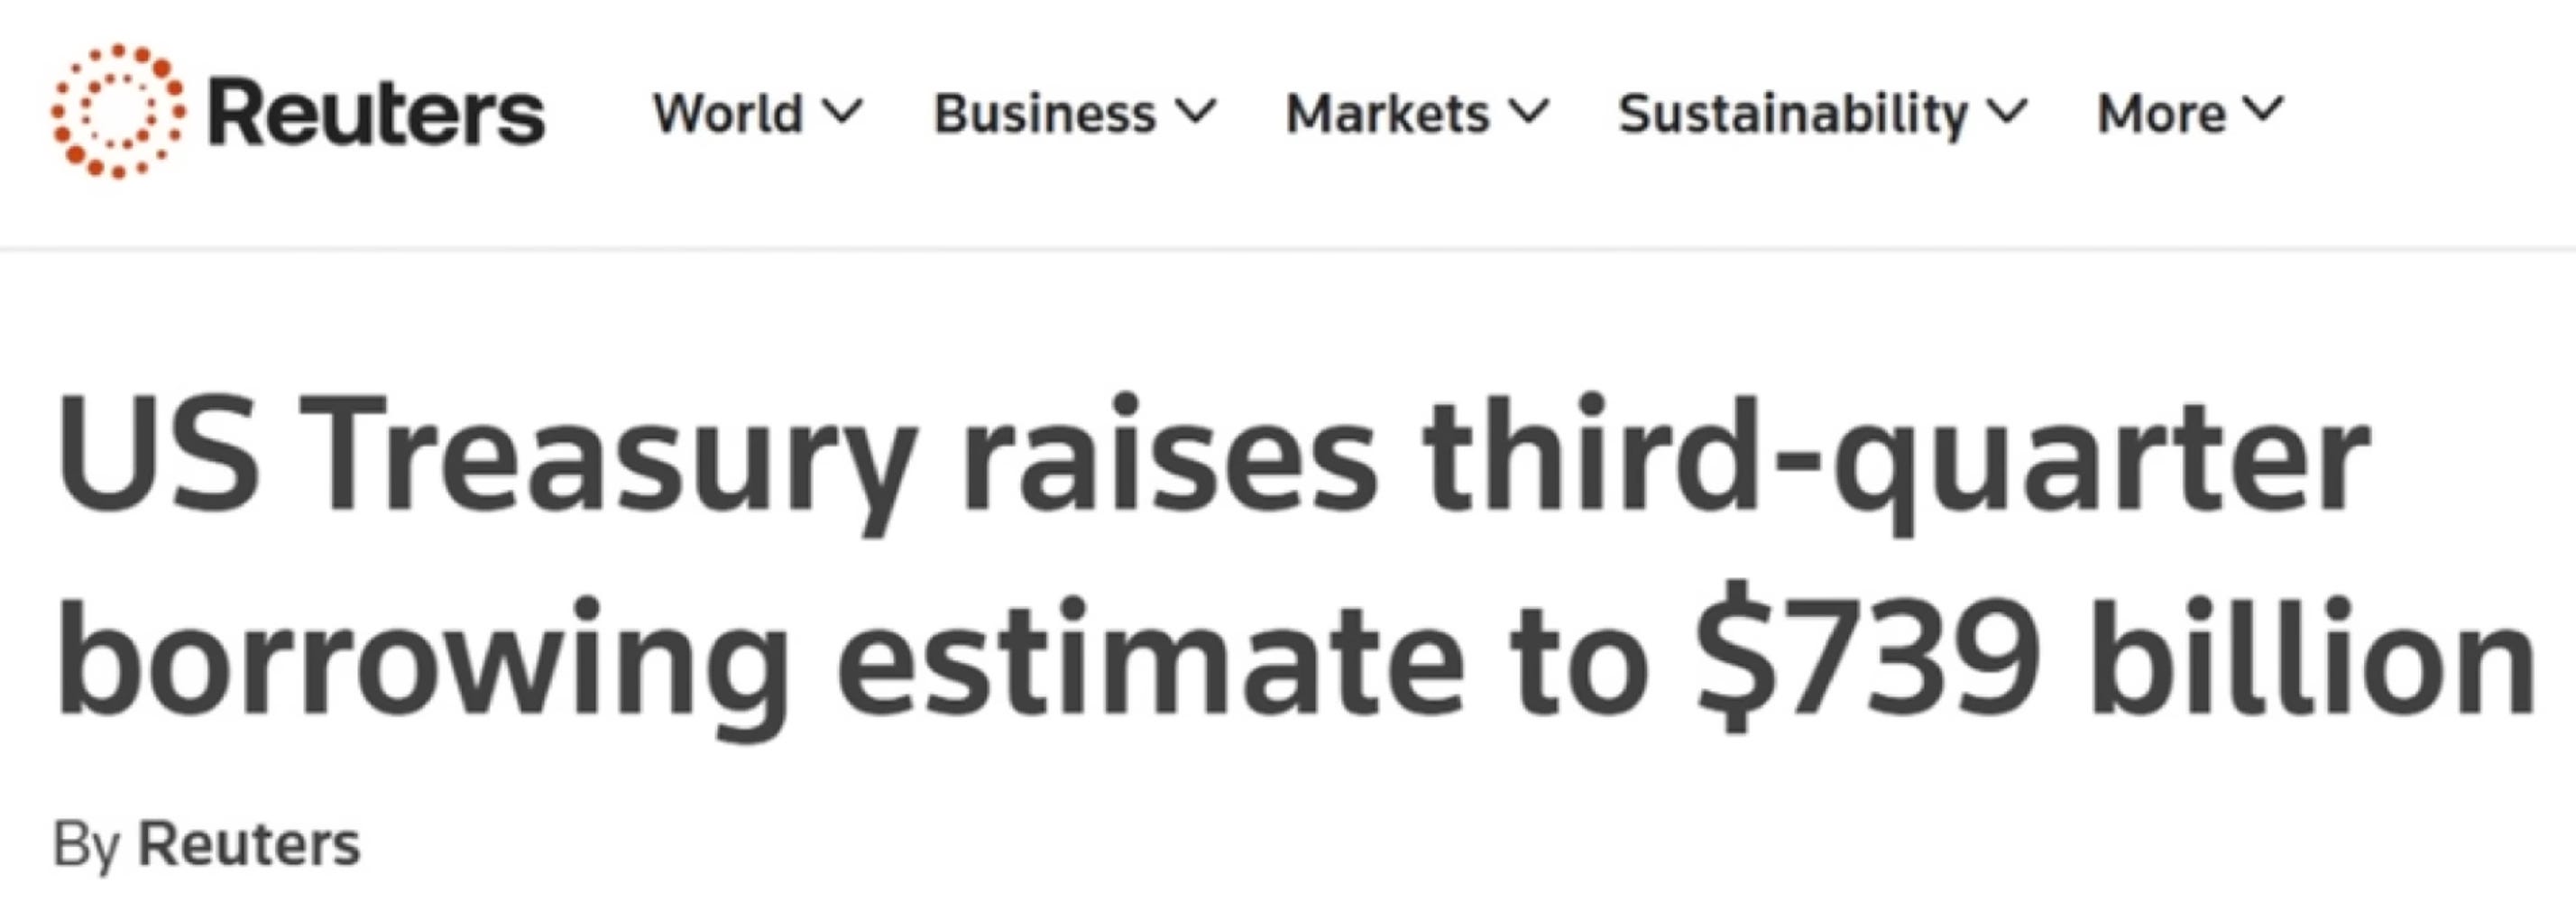
The number comes from a Treasury statement released earlier this month. Unless you trade bonds for a living, you’ve probably never read one of these, and there’s no reason you would have. It’s the financial equivalent of a utility bill.
But this one was worth reading. It tells us that between July and September alone, the government expects to borrow $739 billion.
That’s for a single quarter. Not the year, mind you.
Sure, some government debt is going to mature and some of that will be paid back. But once all the shuffling is done, Washington will be less than $300 billion short of a trillion dollars deeper in the hole, in three months.
But it gets worse.
The same release matter-of-factly adds another $628 billion for October, November and December. Put the two together and you get just under $1.4 trillion of new borrowing in the back half of 2026.

For context, the national debt stood at $39.9 trillion in the second week of August. If the government keeps borrowing at the current pace, we’ll be looking at roughly $41 trillion by New Year’s Eve.
But here’s the thing. I suspect even that’s very much on the optimistic side, and that the final number will be bigger. Let me tell you why.
A Month in the Life of Uncle Sam
Now let me go back to something I skipped over above. The $739 billion is actually $68 billion higher than what they projected in May. In other words, the government’s own forecast was off by nearly $70 billion in the space of just three months.
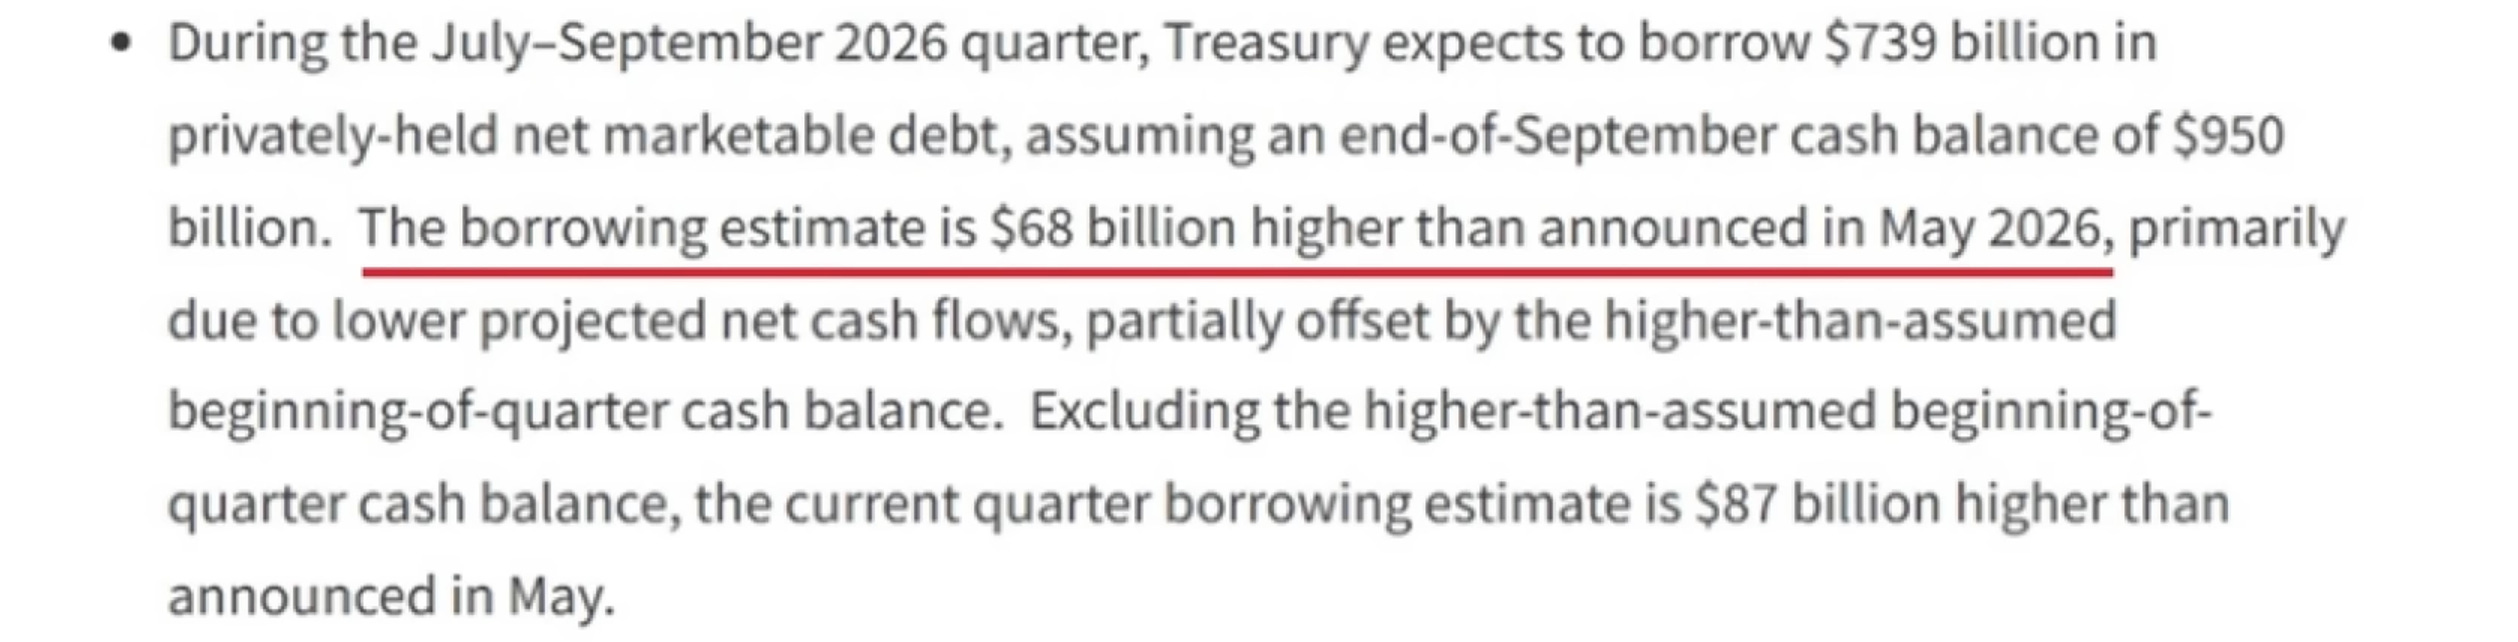
Aside from the fact that they seem to have a knack for getting these things consistently wrong, what changed?
Well, we’re told they’re now expecting “lower projected net cash flows.” Which is another way of saying: less money is coming in than we thought.
Hmm. Interesting. So I guess the economy isn’t doing quite as well as the narrative would have it.
Except we don’t have to guess about it. Nine days after the borrowing announcement, the Treasury published a second document that hardly anybody reads either. It’s called the Monthly Treasury Statement, and unlike the borrowing announcement, it doesn’t deal in projections. It shows you what actually happened. In this case, in the month of July.
I’ve pulled it together for you in the chart below. Money coming in on the left, money going out on the right. Have a look and two things jump out at you right away. In July, the government collected $334 billion. And it spent $766 billion. That’s a hole of $432 billion, in thirty-one days.
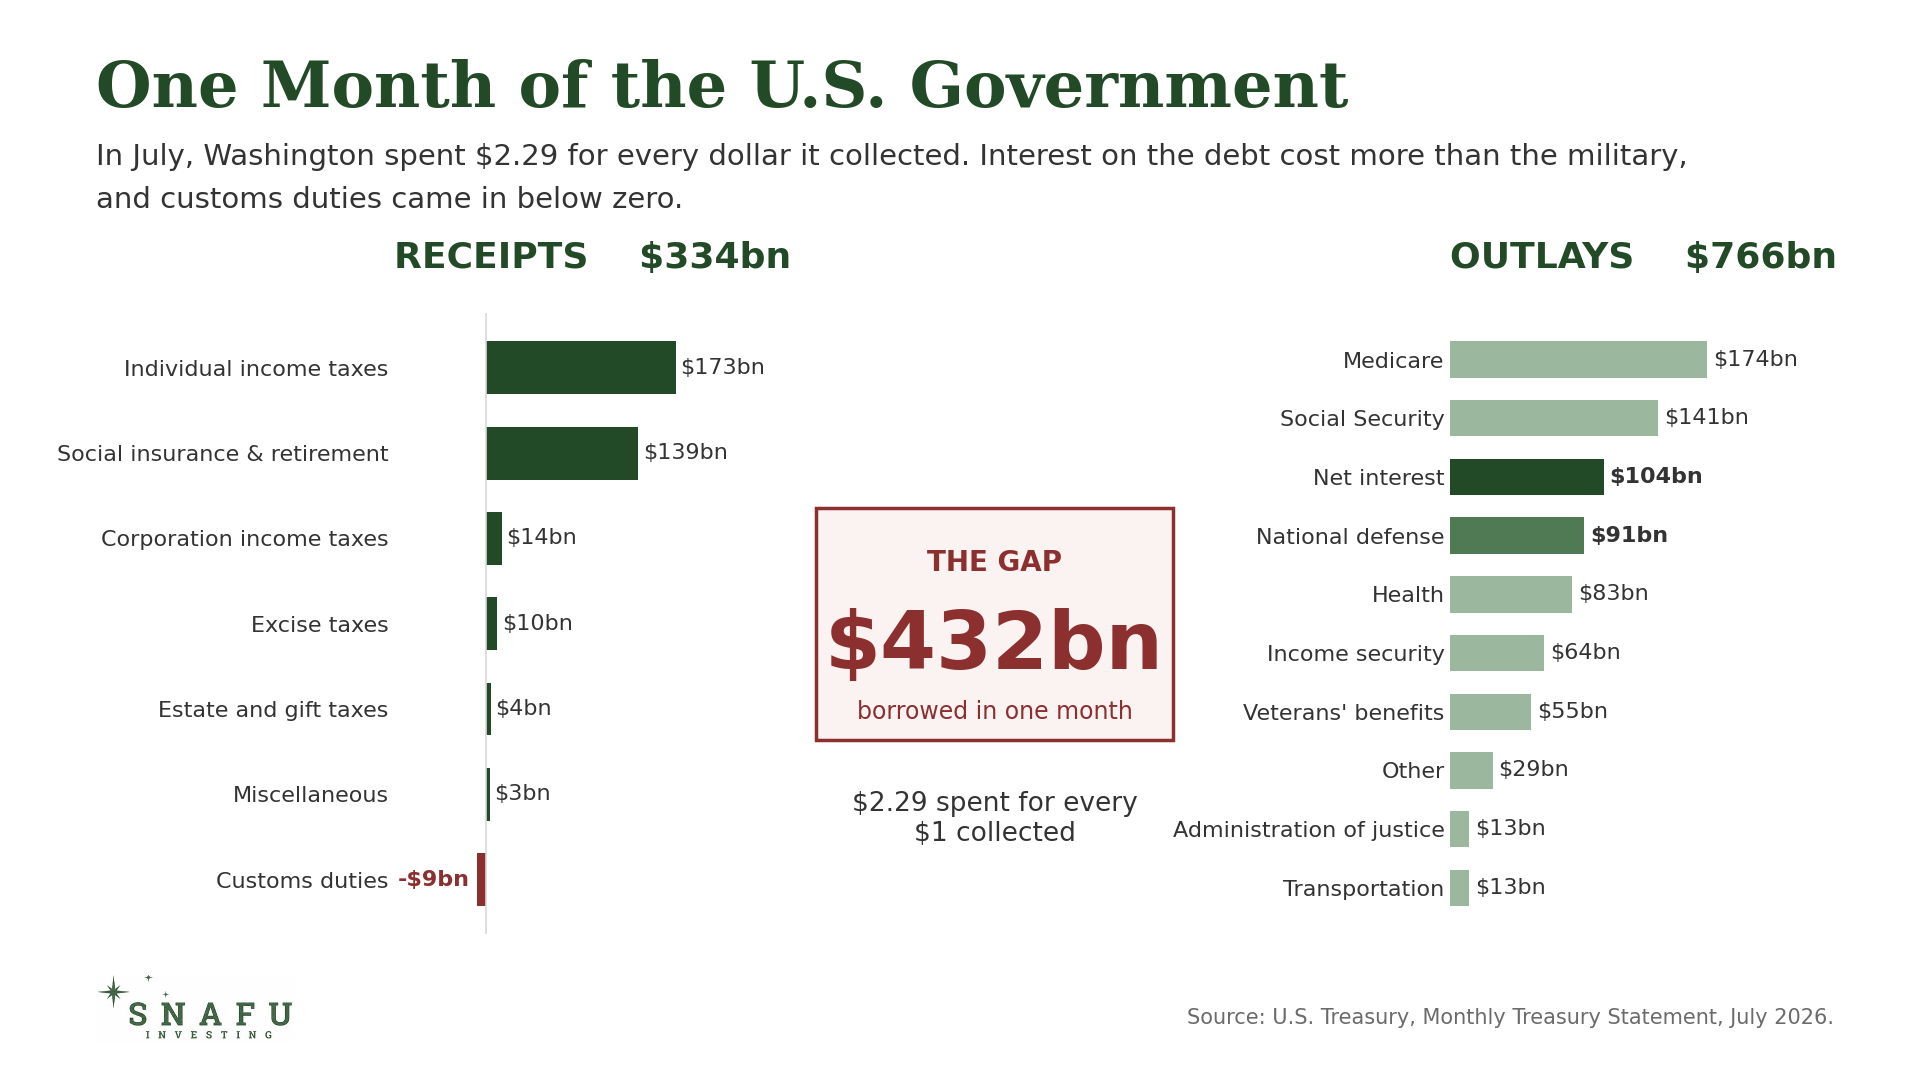
This isn’t just a big number. It’s the largest deficit ever recorded in the month of July.
Mind you, that $432 billion gap doesn’t get filled by magic. It gets borrowed. Which is exactly how a country ends up nearly $40 trillion in the hole, one month at a time.
Now, there are a couple of other figures on that chart I’d like to draw your attention to, because they’re rather important.
Look at the right-hand side, the spending. You’ll see net interest at $104 billion. That makes it the third-largest thing the U.S. government spent money on last month, behind only Medicare and Social Security. Bigger than what Uncle Sam spends on the military. Bigger than the health budget (which is mostly Medicaid). Bigger than income security or veterans’ benefits.
Keep in mind, this is purely the cost of servicing the debt. Not a cent of it goes toward paying down the principal. And the bill grows with the pile. Every trillion added means another payment stacked on top of the last one, and that money has to come out of somewhere.
Let me show you what that looks like from where you’re sitting.
In July, Americans paid $173 billion in individual income taxes. The government spent $104 billion of it on interest. So roughly 60 cents of every dollar you paid in income tax last month went straight back out the door to the people the U.S. government owes money to.
And it keeps getting worse. By the end of June last year, the government had spent $749 billion just on interest. This year? $827 billion. That’s $78 billion more, or better than 10%, in a single year.
Now take a look at where that puts it alongside everything else they spend money on.
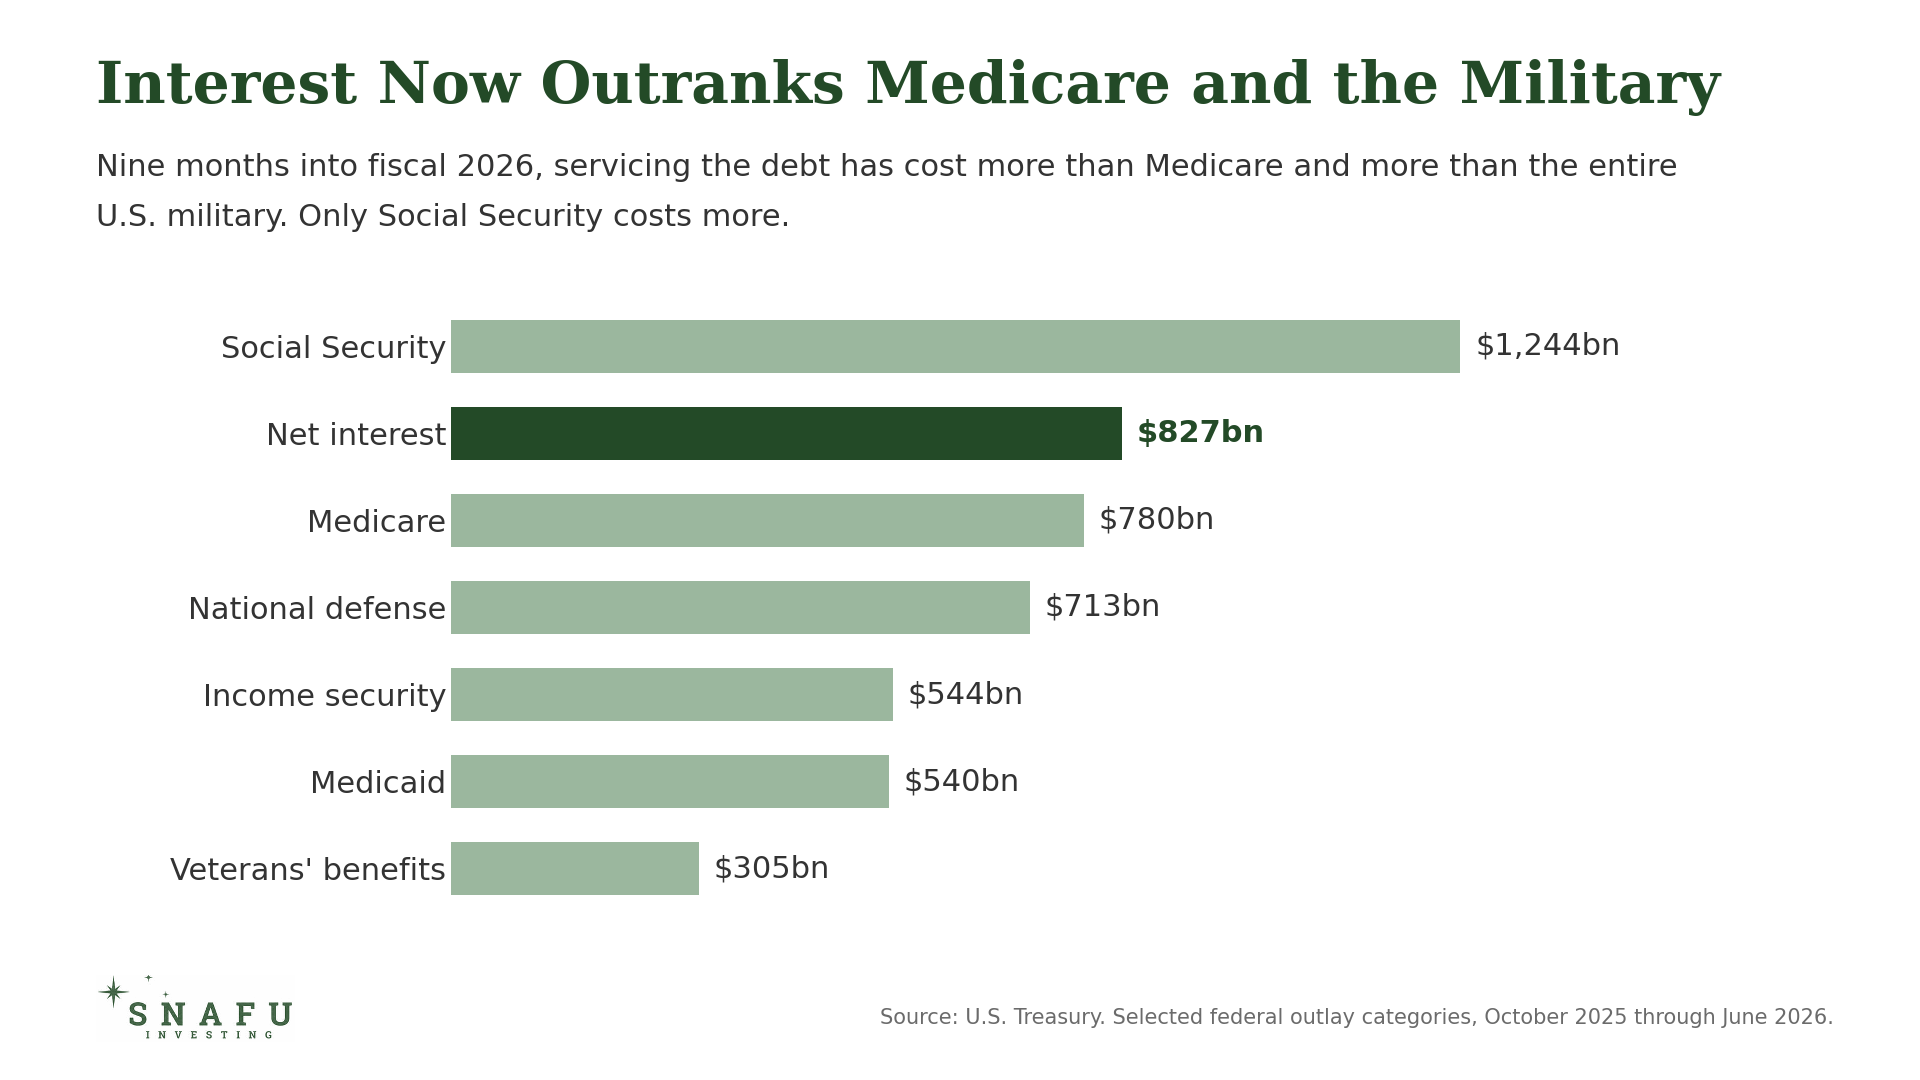
As you can see, across the fiscal year so far, the interest bill isn’t third anymore. It’s second, ahead of Medicare and behind only Social Security.
Where This Leaves Us
There’s one more line I’d point you to, this time on the receipts side of the chart, right at the bottom where the small stuff lives. Customs duties: minus $9 billion.
Minus. But wasn’t tariff revenue supposed to be the thing that helped pay for all of this? And now it’s running backwards.
Now, if you were in favor of the tariffs, you probably blame the Supreme Court for that. After all, it was February’s 6-3 ruling that said the President had no authority to impose them, and the Treasury has been handing the money back ever since. Thirty-three billion dollars of it in July alone.
Fine. It doesn’t change the arithmetic. The tariff plan clearly isn’t working, and while everyone argued about it, America’s fiscal hole only got deeper.
So where does that leave you and me?
My buddy Rob Smallbone over at The Contrarian Capitalist posted this on his Substack the other day.
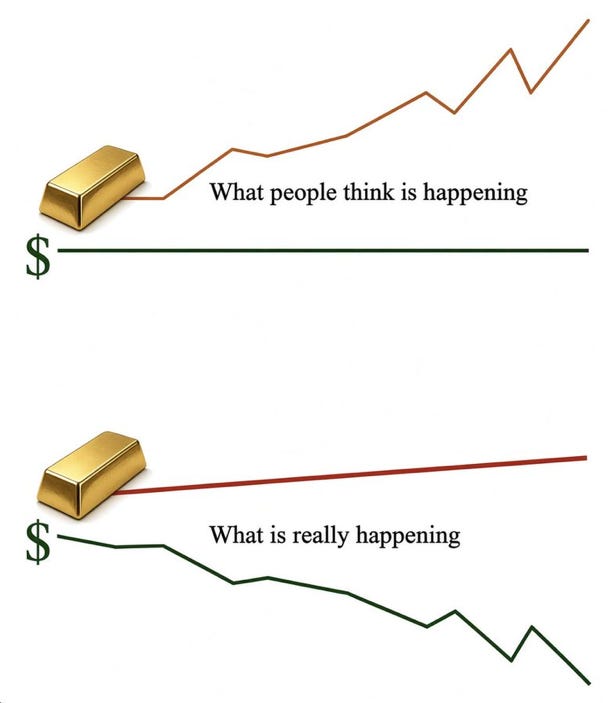
As people say, it’s funny because it’s true. The top half is really how most people see gold’s rise. They look at a good year for the metal and think, wow, gold is having a moment. Completely oblivious to the fact that gold isn't going up. It's fiat going down.
Everything I've seen in 2026 tells me that fall has a long way to run yet.
And when the market finally refuses to keep propping up this growing house of cards, or the next government-induced crisis threatens to bring it down, the Federal Reserve will step in as the buyer of last resort.
Which, of course, means printing trillions. Which means regular people will get wiped out, the middle class will shrink further still, and only those holding what I like to call unprintable assets, along with the companies that produce them, will have a chance of keeping up (or even coming out ahead).
That’s not a prediction of some exotic collapse, mind you. It’s the same playbook we all watched in 2008 and again in 2020. The only question is timing.
Have a great rest of the weekend,
Lau Vegys
P.S. All of the above is the reason SNAFU Investing's second recommendation was a precious metals play. It's up nearly 30% since I sent it to paid subscribers in July, which puts it slightly above our buy-up-to price, so it's a buy on dips only for now. But I'll have another precious metals recommendation going out later this month. Keep an eye out for it in the days ahead.
This is perhaps the most important post anyone has ever made on Substack . This would be of enormous value to our community if you do a similar post monthly … nothing could possible be more impotent from an investment perspective . Thank you !
Excellent articles like this one are reconfirming to me: the fundamental analysis is of such high quality that I can also trust the SNAFU investment recommendations. I feel good about being a paying subscriber of Lau Vegys. (Actually my first paid subscription on Substack, after considering many others). Thanks for your work, Lau!