


Gold just had its worst week in eight months. On Friday it touched $3,514 an ounce, its lowest in more than a year, and it’s now down more than a third from the record of about $5,590 it set in late January. The stocks that mine it have fared even worse, which, as you’ll see in a moment, has left us with some incredible opportunities.
Now, if you read my October 31 essay, you know my short version: I see this as a flush in the middle of a bull market, not the end of it.
That said, the selling has only gotten heavier since. So I want to walk you through two things: why it’s all down, and why I don’t think it stays down.
And mind you, I’ll make that case without even mentioning the $40 trillion U.S. debt, the $2 trillion deficits, or the more than $1 trillion a year the U.S. government now spends just on interest.
Then I’ll show you the miner I’m buying because of all this. And it’s not just any miner. It’s one of the lowest-cost gold producers in the world, and it’s on track to double its output without needing a higher gold price to do it.
Let’s dig in.
Why Gold Got Caught in the Selling
So what happened? The short answer is that over the past few weeks, almost everything fell. If your portfolio is red right now, so is almost everyone’s.
Here, for example, is what the S&P 500 looked like over just the past seven days. It’s a heatmap: each box is a company, sized by its market value, and red, well, means it fell.
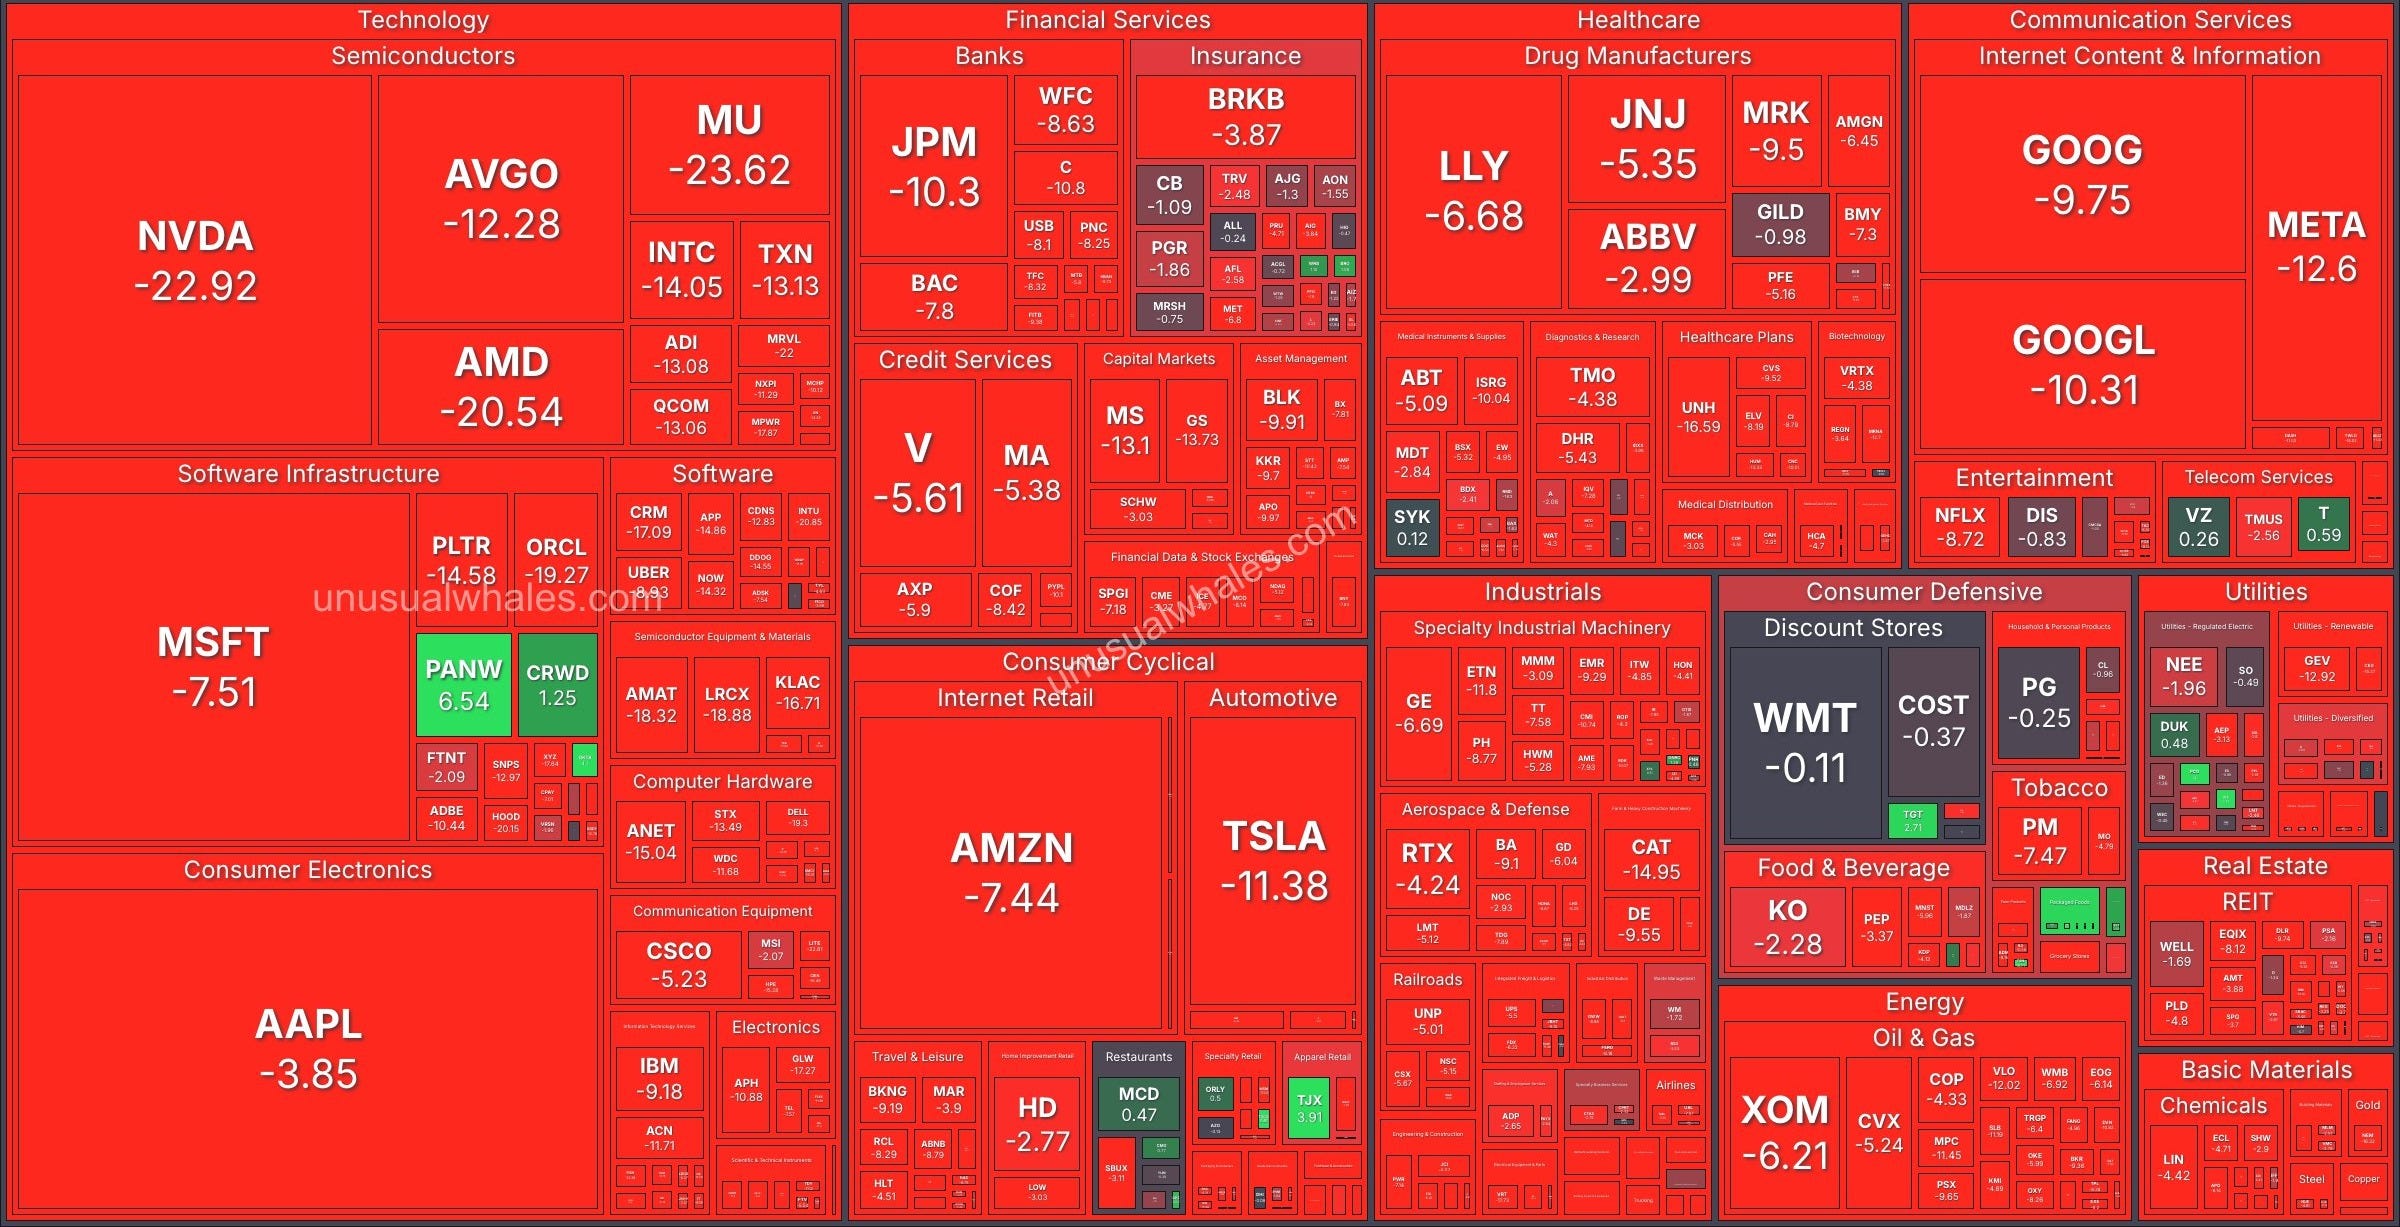
As you can see, the AI names led the way down. Nvidia lost nearly 23%, AMD more than 20%, and few corners of the market were spared.
None of this should come as a surprise. I’ve written about how lopsided this market is more times than I care to remember. When a handful of AI giants make up a huge share of the S&P 500, you’re dealing with a house of cards. Pull out the top few, and everything else comes down with them.
Now, it may sound counterintuitive, but that’s bad for gold too. When stocks drop like that, anyone who bought the AI trade with borrowed money gets a call from their broker. And it just so happens that gold is about the easiest thing in their portfolios to turn into cash. So they sold it too.
Nicky Shiels, head of research at the Swiss refiner MKS PAMP, summed it up well last week. In the short term, she said, gold is a liquidity asset, “the thing you sell to raise cash.”
That, of course, isn’t a judgment on gold. It’s a judgment on everything else the seller owns.
The Buyers Who Didn’t Flinch
To be fair, gold had been easing lower for most of this year, well before the past few weeks. And as I’ve written before, a lot of that was interest rates: a Fed that’s hiking again, inflation running hot, the usual suspects.
After all, the conventional wisdom goes, why hold something that yields nothing when a 10-year Treasury pays you about 5% just to sit there?
But you know who doesn’t seem to agree with it?
Central banks.
Remember, they were among the biggest buyers behind this bull market, the ones who helped push gold above $5,500 an ounce in January. So when the price started falling, you might assume they packed up and left.
They didn’t.
When I showed you a version of this chart in October, it was missing the latest quarter. The third-quarter numbers came out earlier this month, and they confirmed what I suspected. Take a look:
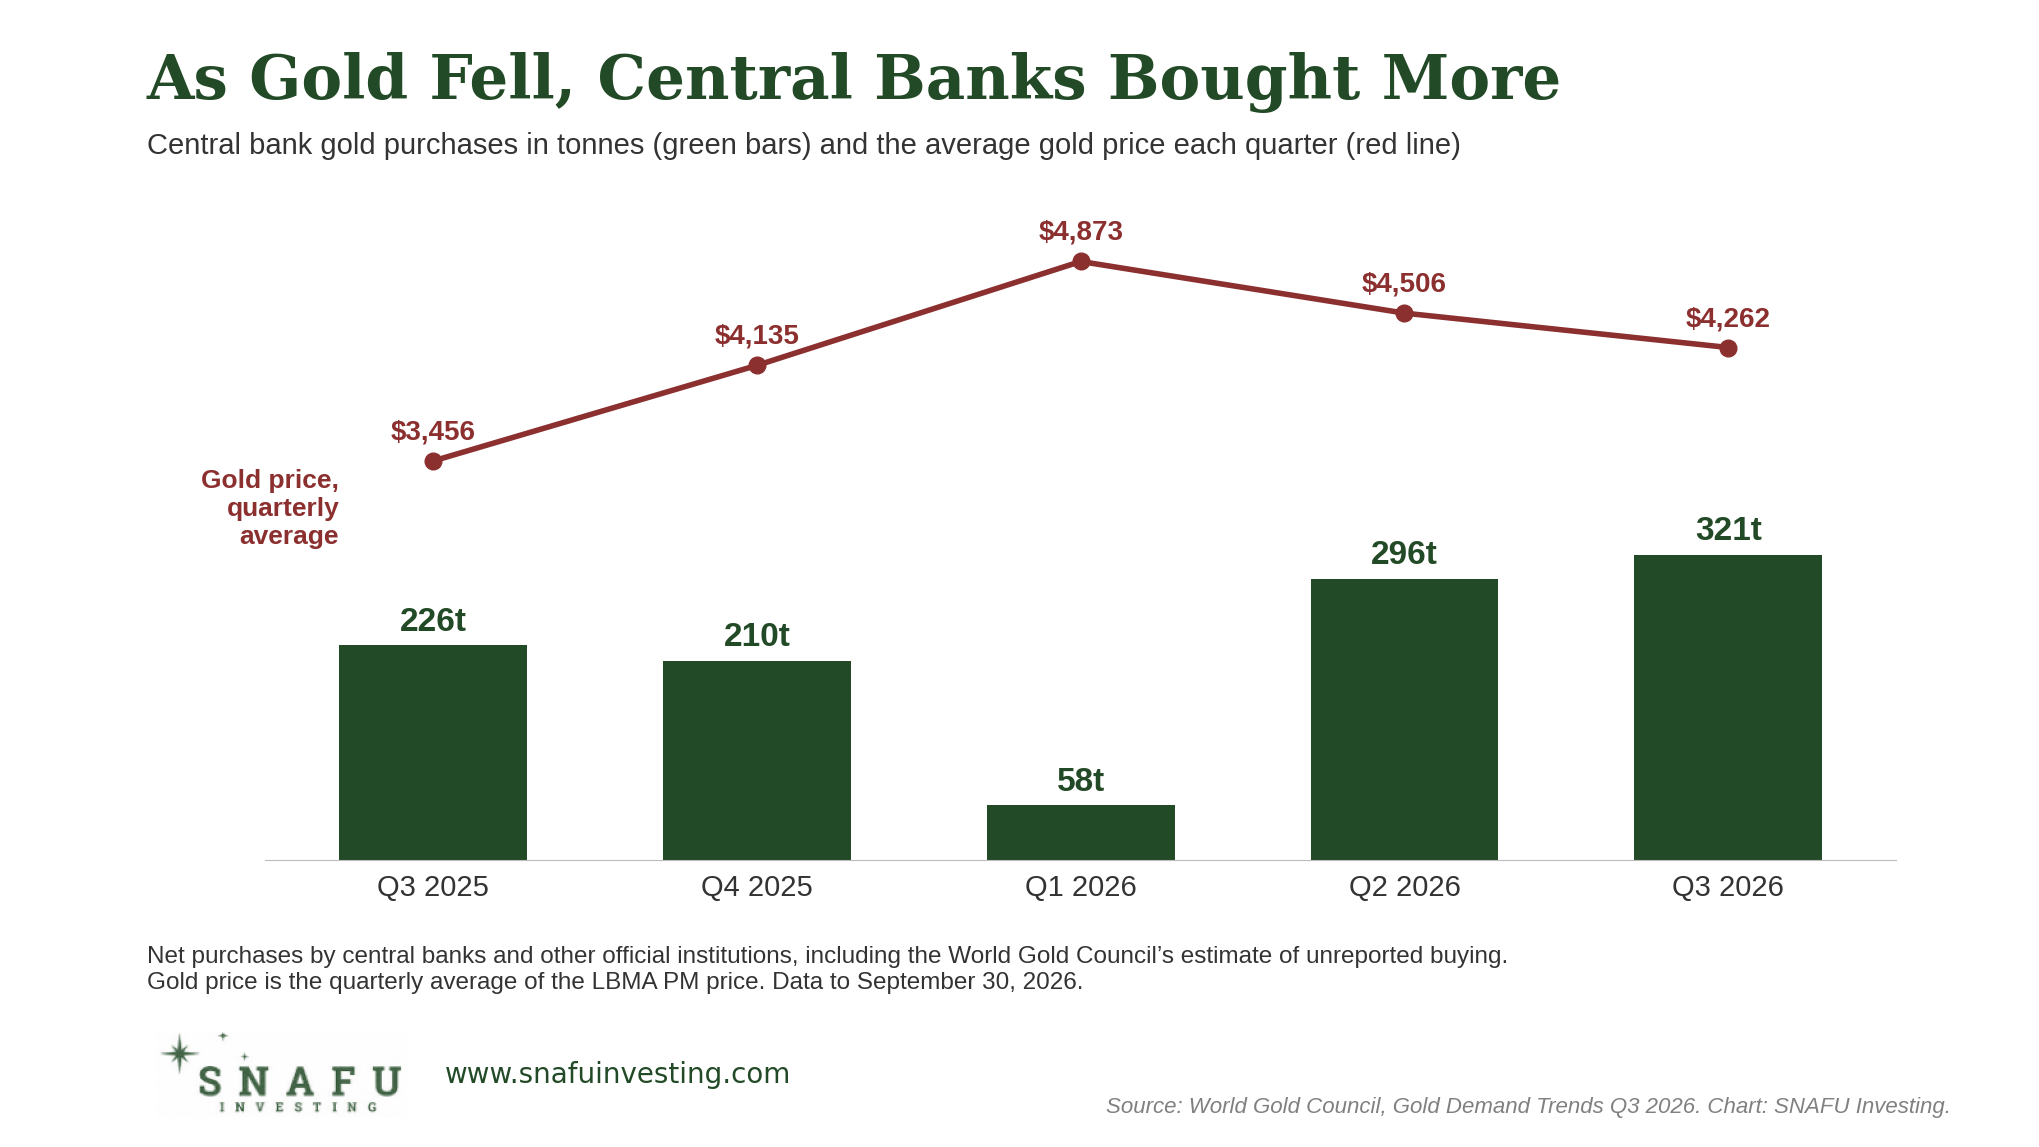
If you’d only followed what central banks officially reported, you’d have seen them buy about 120 tonnes of gold in the third quarter. Respectable, but nothing to write home about.
But that’s not what actually happened. The World Gold Council, which tracks the gold actually moving through the market, calculated the real number at 321 tonnes, the one in the chart above and the most in nearly two years.
That sounds impressive. But even 321 tonnes is probably too low. Here’s why.
At the end of the day, it’s an estimate, and it can only pick up the gold that passes through markets someone is watching. A central bank that buys straight from its own country’s mines, or moves gold through channels that never touch London, will slip right past it. And the best example of such a country is, of course, China, where how much gold the government really holds is anyone’s guess outside Beijing.
Note: There’s a much bigger story behind why central banks keep piling into gold, and why even America’s allies have started bringing theirs home from New York. It deserves more room than I can give it in an issue built around a new pick, so I’ll lay it out in full in an essay later this week.
The point is, while everyone else was dumping gold, central banks were quietly backing up the truck.
And they’re not alone.
Investors in gold ETFs have been doing the same thing. Their holdings hit a record 4,275 tonnes at the end of October, even as the price kept falling:
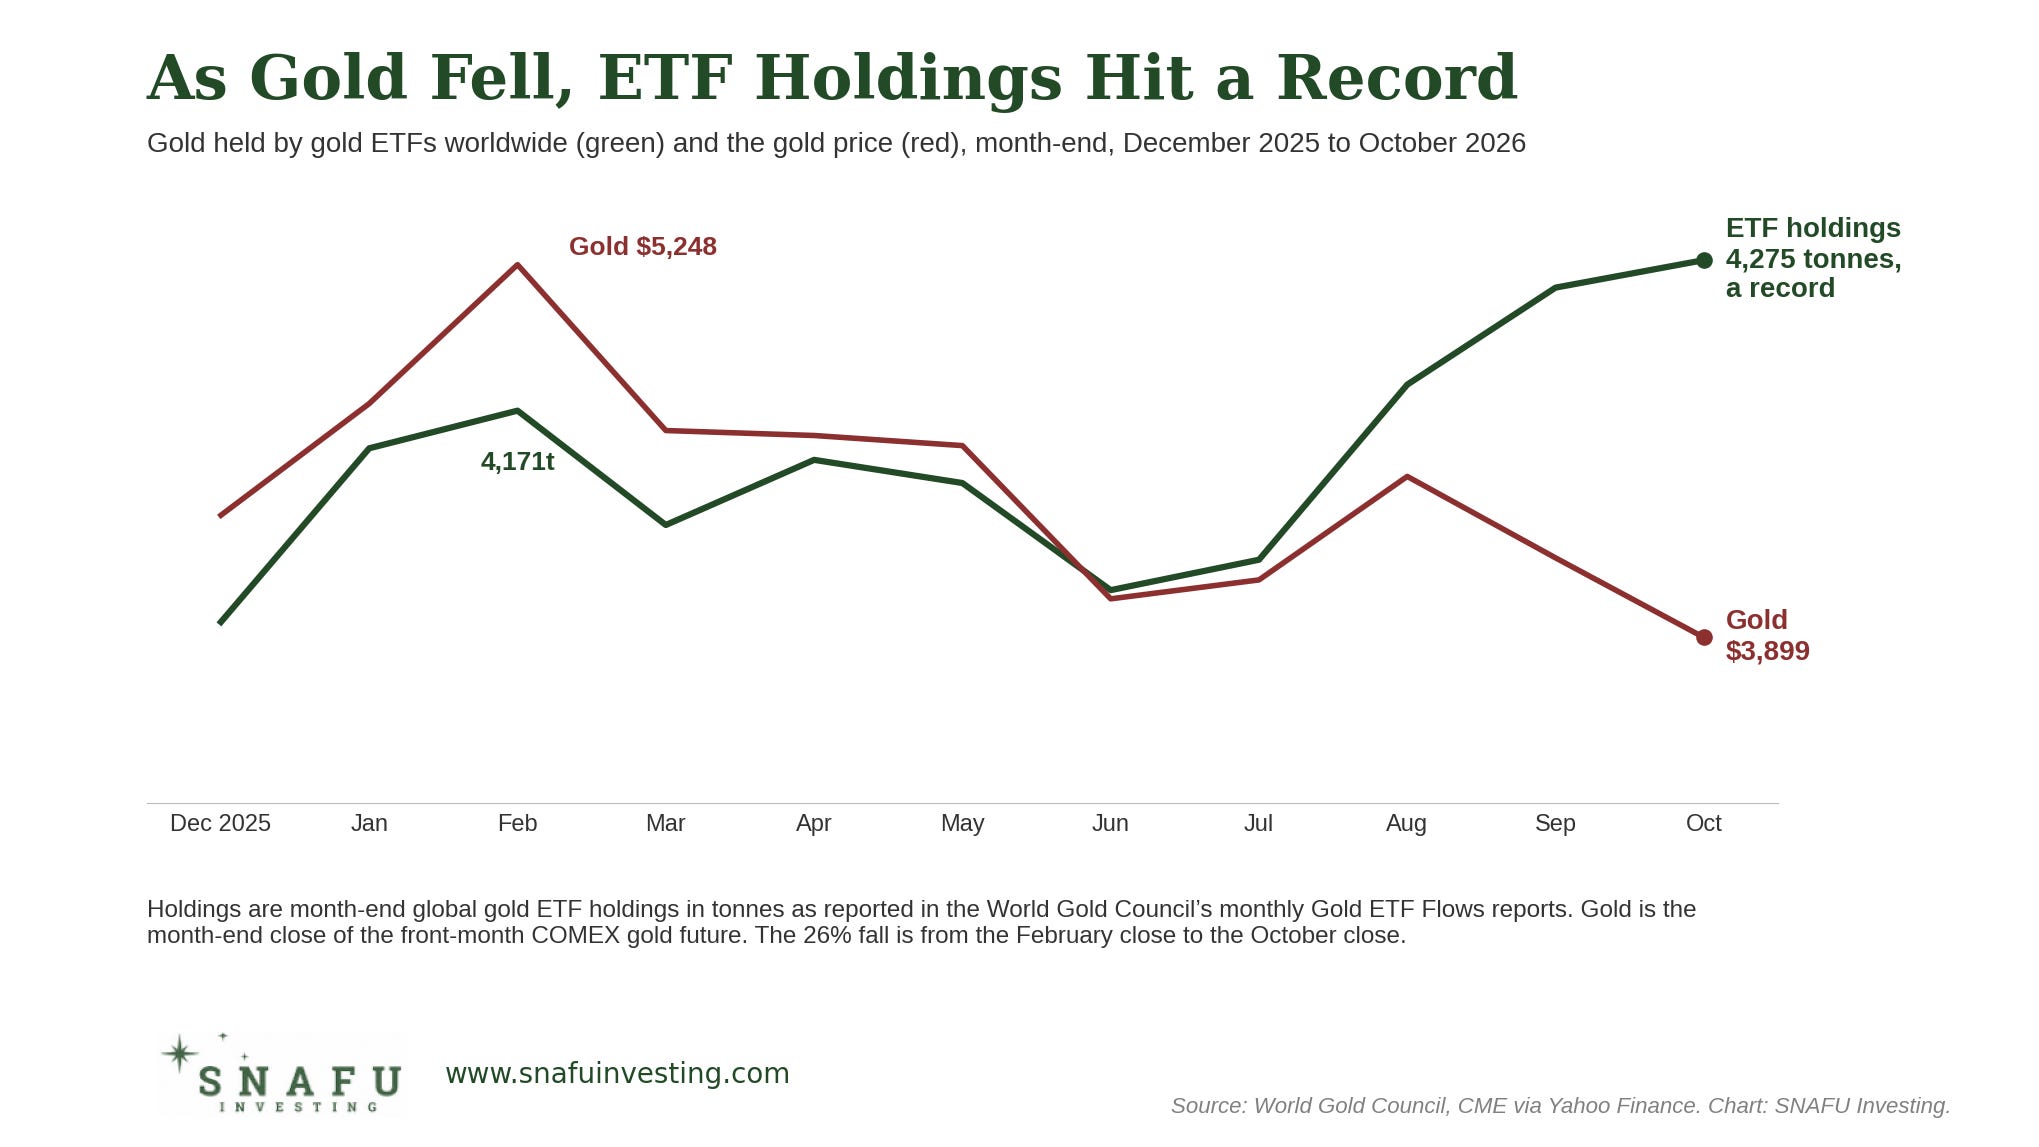
By now, you can probably see that the real picture doesn’t quite match the headlines. If I had to sum it up in one line, it would be this: paper gold is being sold by people who need cash, while central banks and investors buy the real thing to keep.
The Flush in the Middle
Needless to say, I see this as an opportunity, not a reason to run. And the best reason I can give you is that gold has been here before.
You see, gold bull markets have a rhythm. Since gold started trading freely in 1971, there have been three major ones, the big multi-year runs that changed what gold was worth: the 1970s, the 2000s, and the one under way now. I showed you the chart below before. Here it is again, updated to Friday’s close, with each bull market measured from where it started:
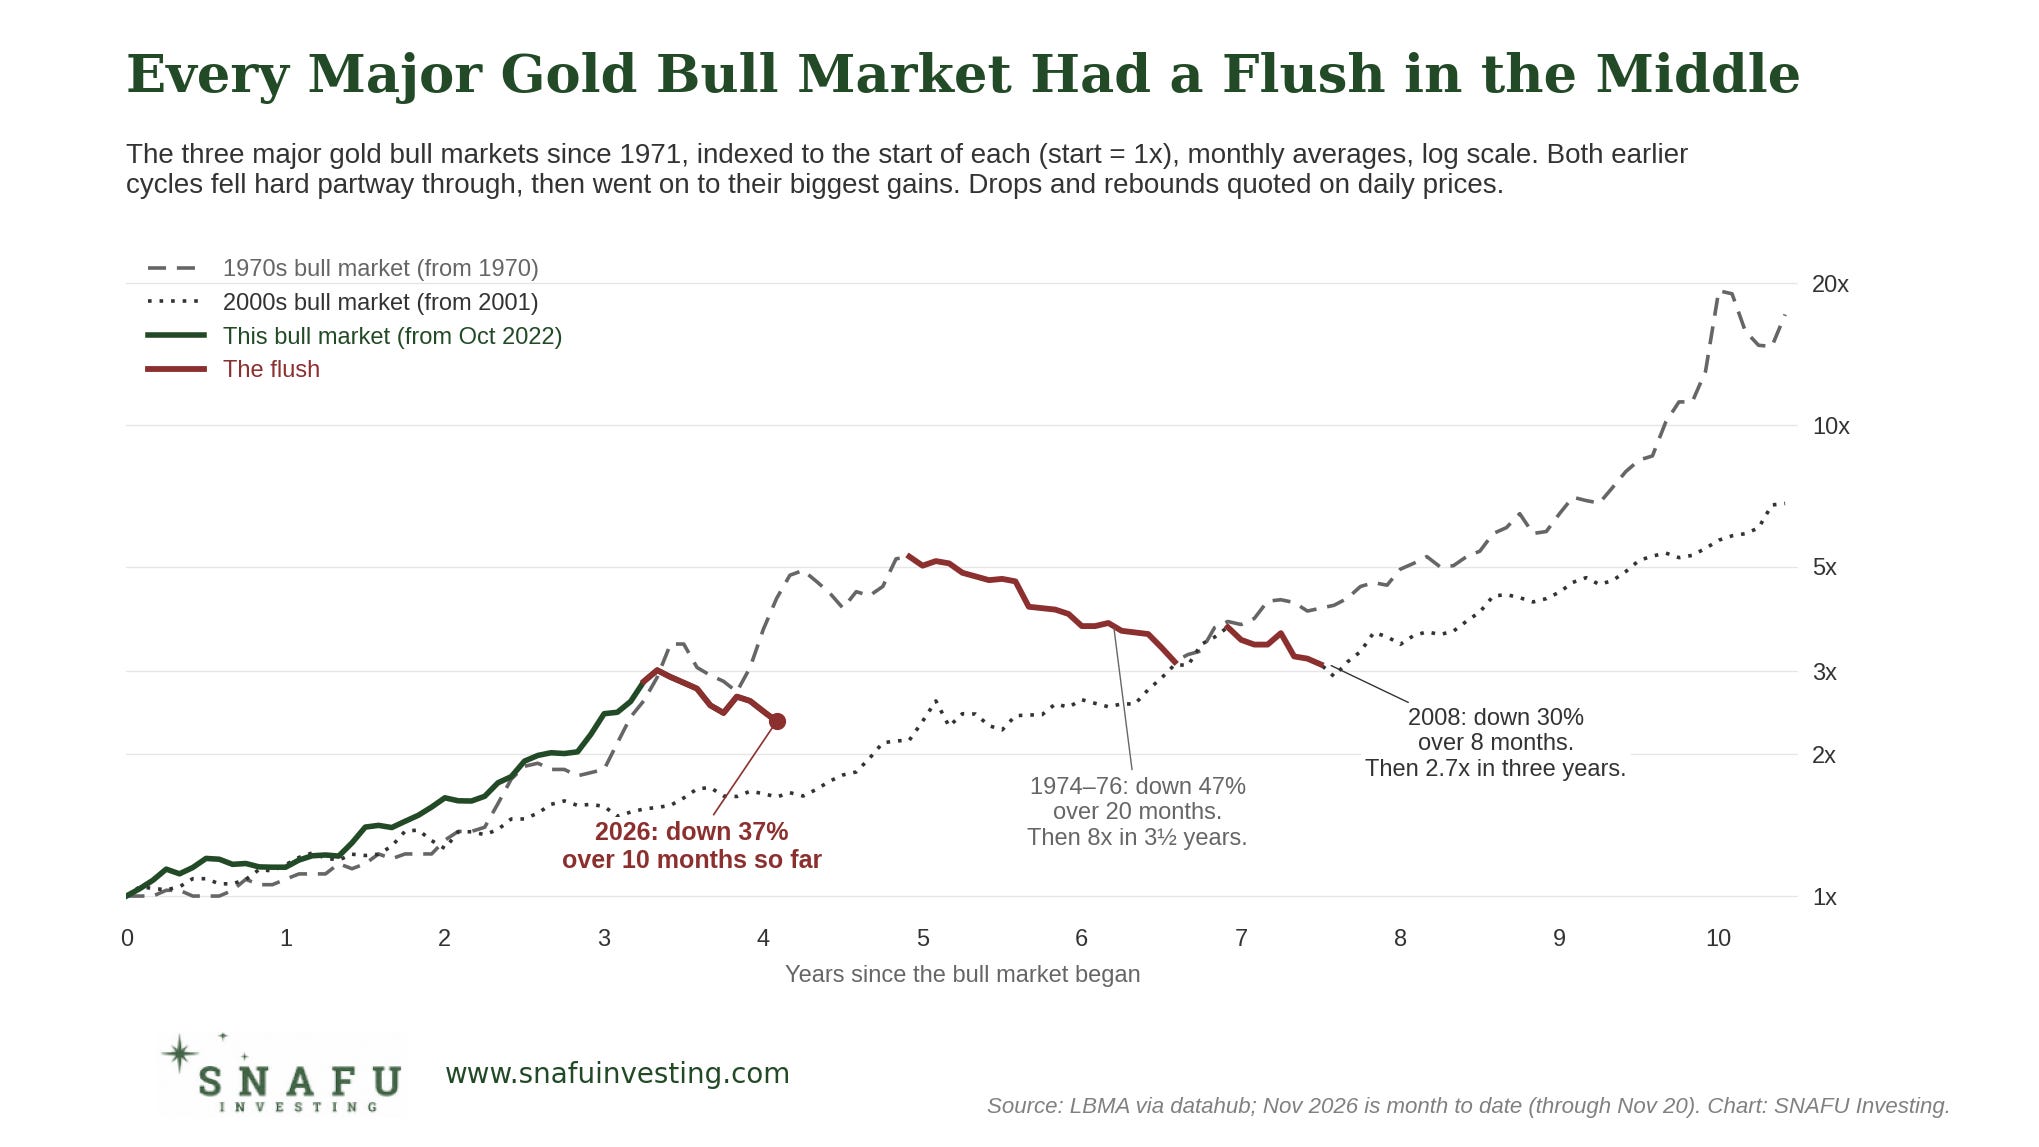
What should jump out at you is the red. Every major bull market had a flush in the middle, and every time, it convinced people the bull market was over.
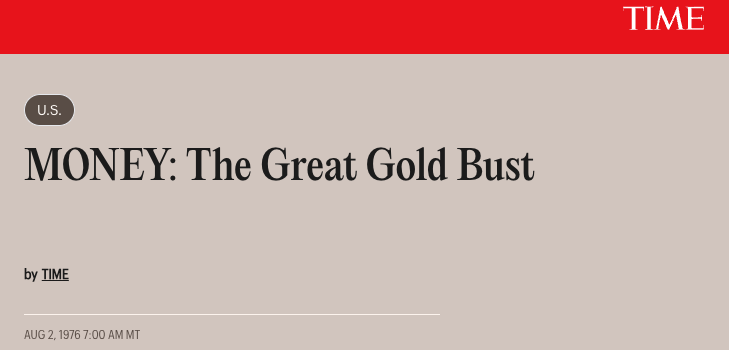
In the 1970s (the dashed line), gold ran up more than fivefold, then fell 47% between the end of 1974 and the summer of 1976. Twenty months of decline. In August 1976, Time magazine ran a story called “The Great Gold Bust.”
Then it rose about eightfold in three and a half years, to $850.
And here’s the part many people seem to have forgotten. Most of that climb came while the Fed was raising rates, taking its benchmark rate from under 5% in early 1977 to around 14% by the time gold peaked in January 1980.
Well, what about the 2000s? Same story. Gold (the dotted line) nearly quadrupled, then dropped 30% in the 2008 crisis. Eight months, peak to trough. Then it went from about $712 to nearly $1,900 in three years.
So here’s my point. In both cases, the flush came several years into the bull market, after a big run. And in both cases, the biggest gains came after it.
And if we look at the green line, which is the current bull market, gold more than tripled from the 2022 low, and it’s now down more than a third from the top. That’s exactly what the middle of a major gold bull market has looked like, twice before.
But you don’t have to go back decades to see the same pattern.
March 2020 is a good example too. When COVID hit, everything got sold at once, much like now. The S&P 500 lost about a third of its value in a month, and gold wasn’t spared either: it fell more than 12% in under two weeks, to around $1,470, as investors scrambled for cash. Well, with the benefit of hindsight, we now know that was the bottom. Five months later, gold hit a new record above $2,000, up about 40% from that March low. And today, even after this year’s drop, it’s still around $3,500, nearly two and a half times what it cost in March 2020.
Why the Miners Are the Real Opportunity
I mentioned earlier that the miners have fared even worse than the metal. Take a look at the chart below to see how much worse:
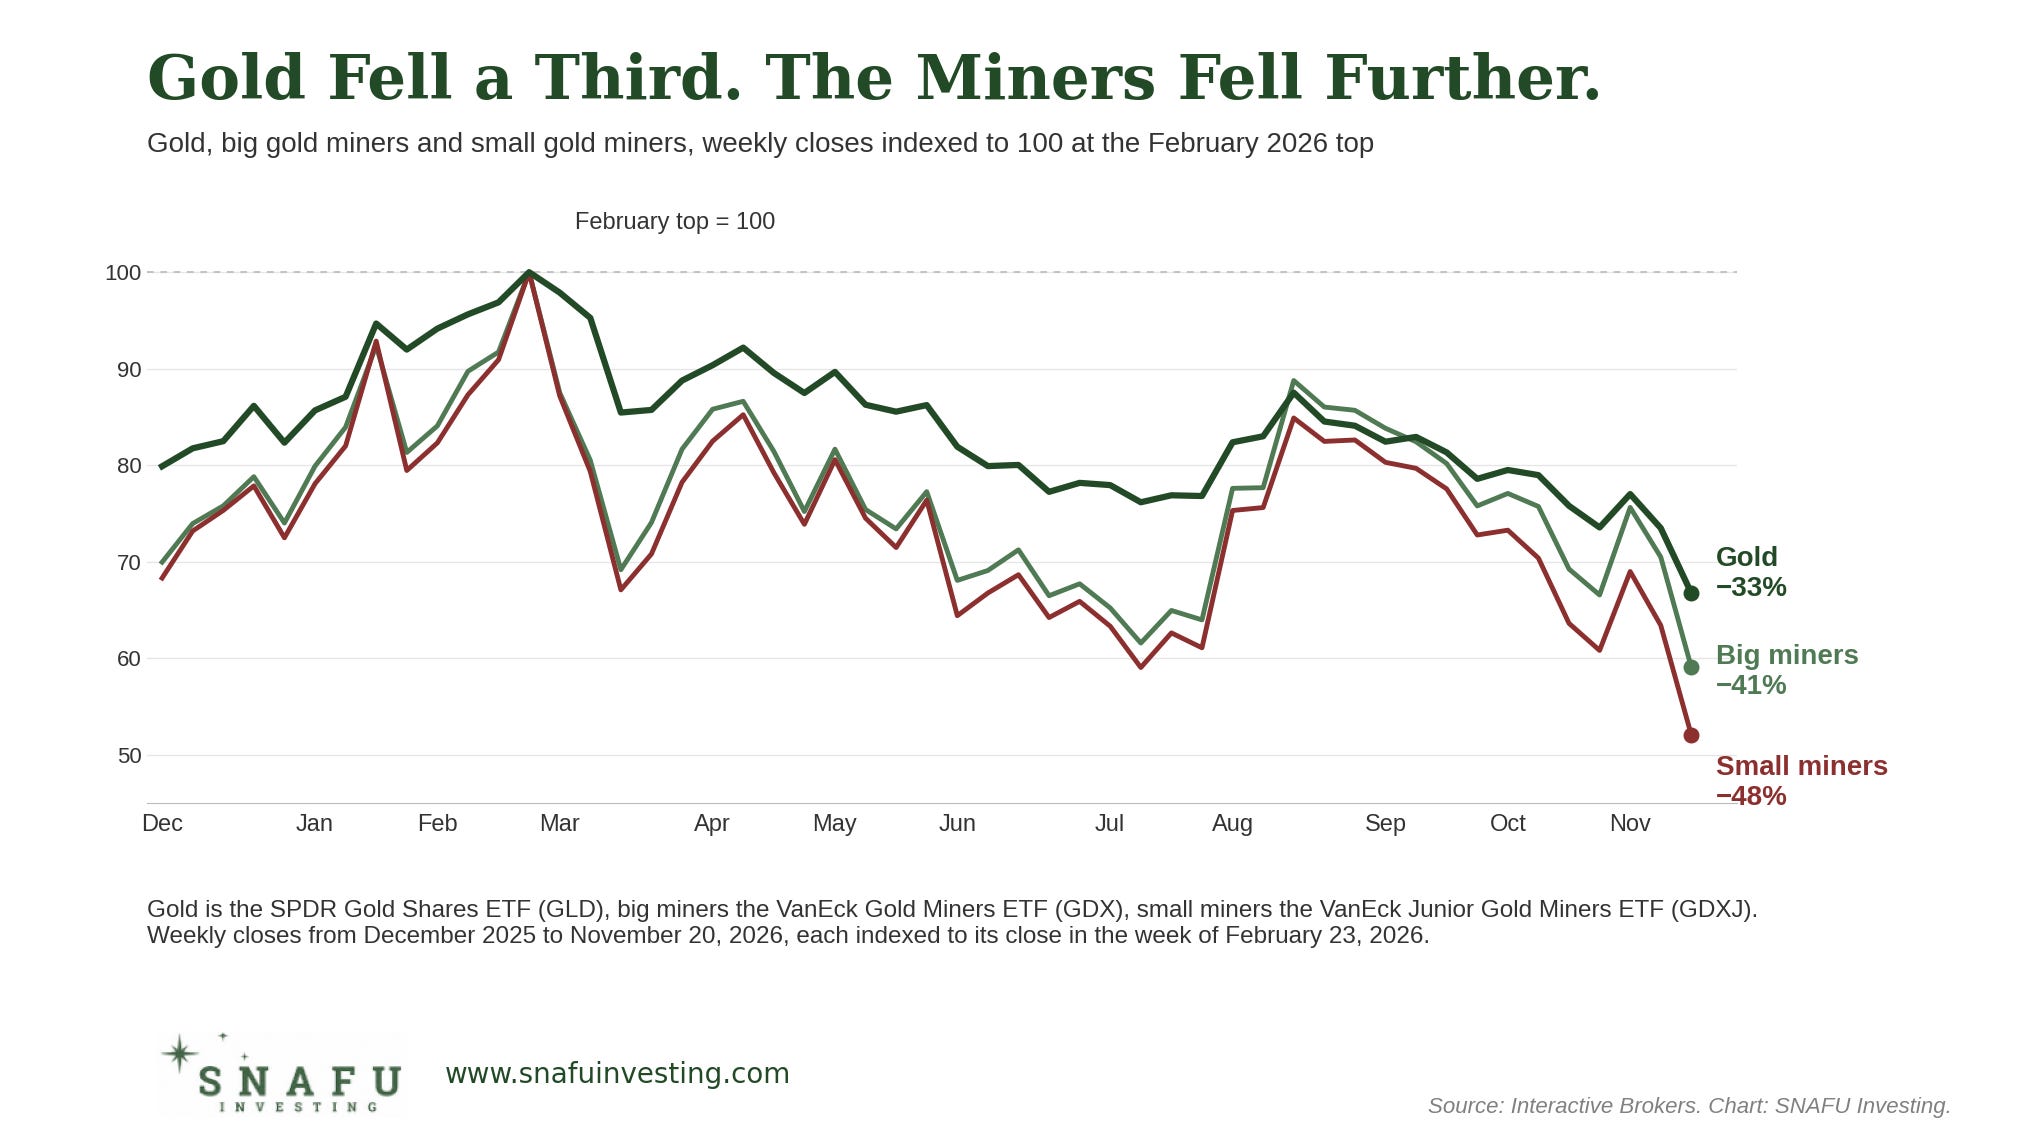
The dark green line is gold. The lighter green line is the big gold miners, and the red one is the smaller miners, all set to 100 at the February top. Gold is down 33% since then. And the miners? The big ones are down 41%, and the small ones nearly half.
In other words, if the metal has had a bad year, the miners have had a terrible one. The market is pricing them off the gold price alone, not off the businesses.
And inside the businesses, the money is still pouring in. The average gold mine cost a record $1,930 an ounce to run in the second quarter, the latest figure Metals Focus has published. Even at today’s price, after the whole sell-off, that still leaves about $1,600 on every ounce.
That’s the big difference from the AI trade everyone keeps talking about (me included). Most of the AI story, you see, is about heaps of cash that’s supposed to show up someday. The gold miners are making it now. Take a look:
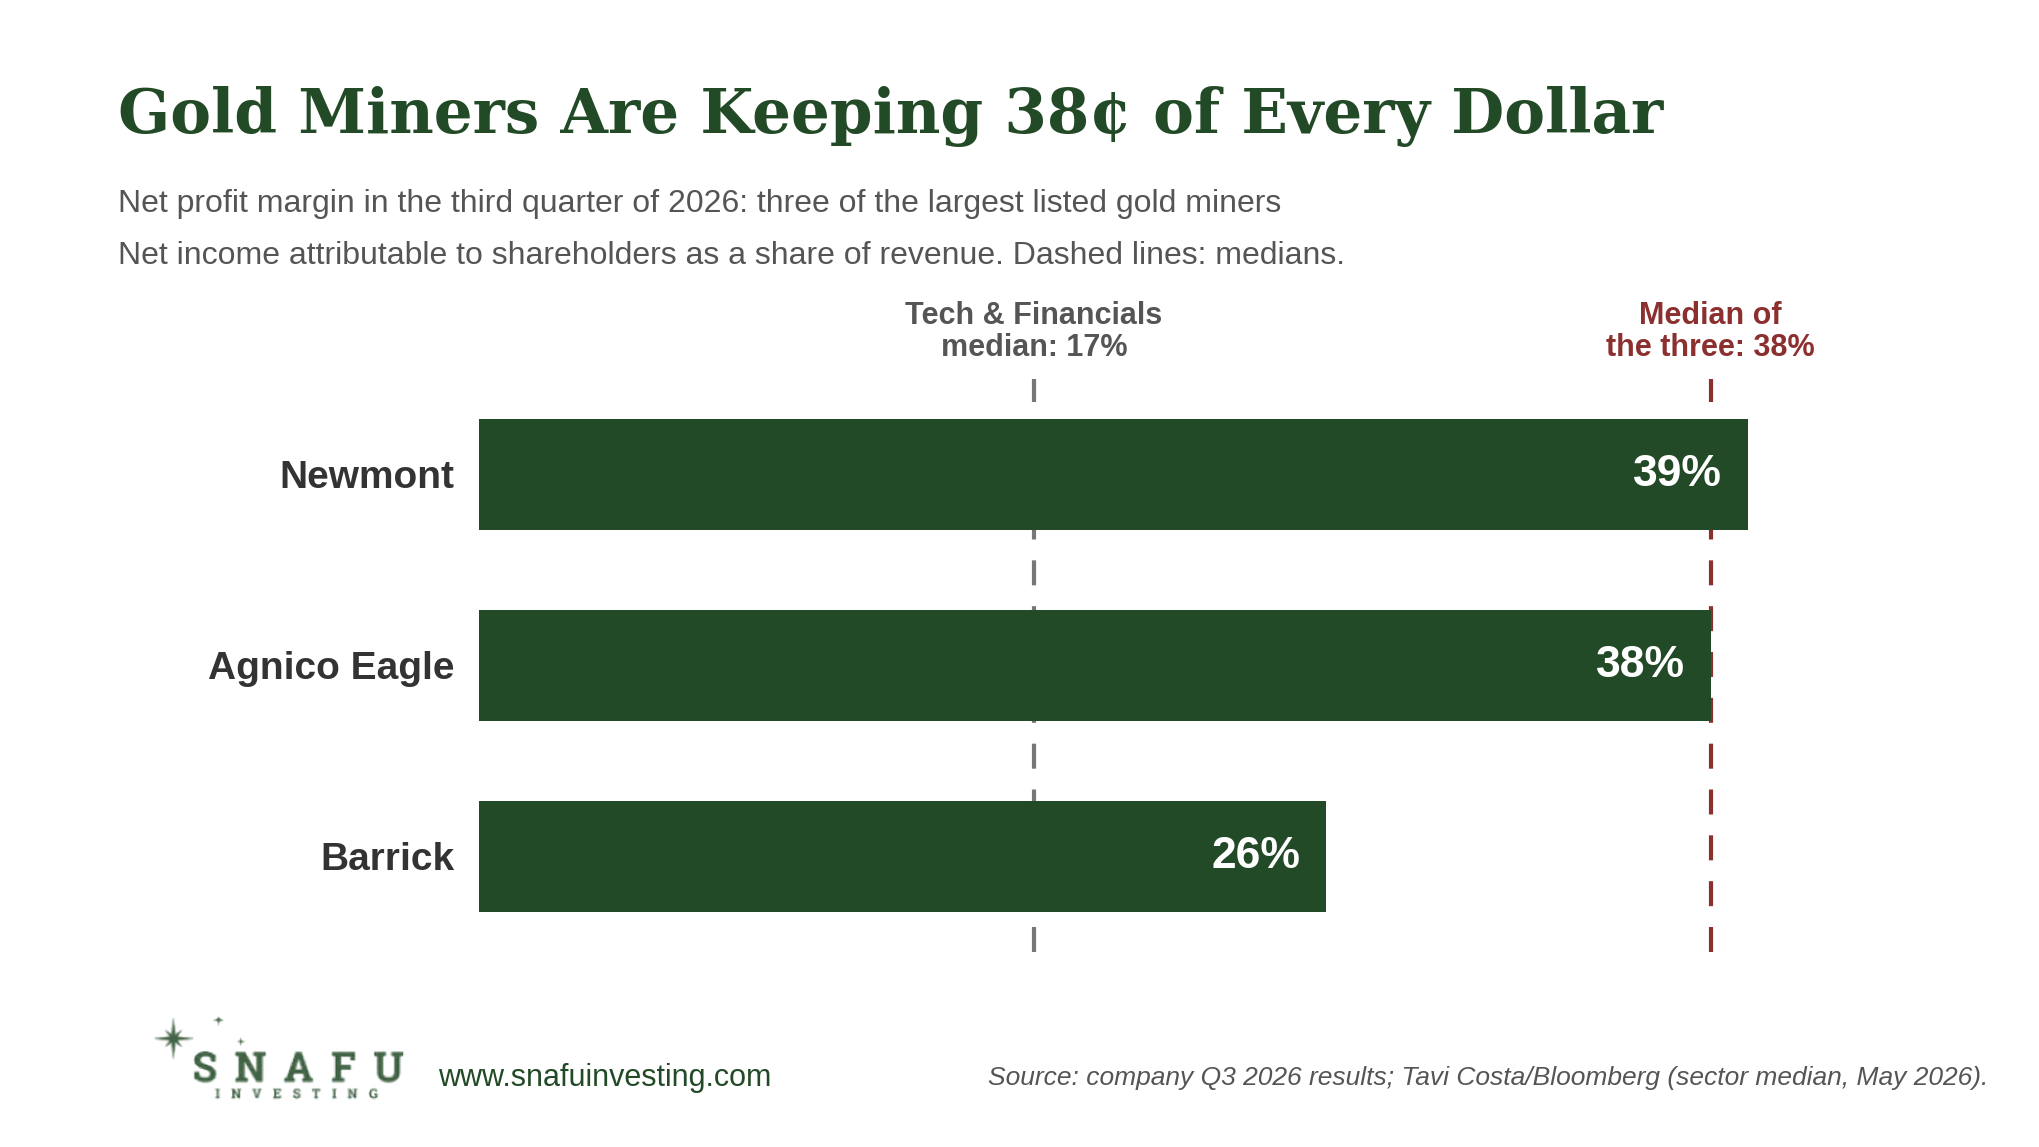
In the third quarter, three of the largest gold miners kept a median 38 cents of profit on every dollar of sales. For the median tech or financial company, it’s 17 cents.
And yet, in late October, before this latest leg down, the senior producers already traded at about 6.8 times their expected cash flow over the next 12 months, against an average of 8.8 over the past five years. They’re cheaper still today.
And that brings me to this month’s recommendation.
Now, I could have simply picked one of the majors in that chart above and called it a day. They’re fine businesses. But I wanted more than fine. I’ve been looking for a gold producer that does three things: makes a lot of money at today’s price, not just at the peak; operates somewhere I don’t have to worry about the government taking the mine; and grows without needing to sell shares to pay for it.
And there was a fourth thing. I also wanted a company that keeps making money and keeps growing even if gold keeps falling. That’s because, for all the evidence I’ve just laid out, I don’t have a crystal ball, and it would be dishonest of me to tell you the bottom is 100% in.
The company I found does all four. Its costs are among the lowest in the industry. It’s growing fast, and paying for that growth out of its own cash flow. And it has already protected itself against a lower gold price without giving up the upside.
In other words, it’s built for a moment like this one. And thanks to the across-the-board sell-off, its stock has been marked down right along with everything else in the sector.
That’s why I’m sending this out over the weekend, earlier than I normally would. I want you to have the full case in hand before the market opens on Monday. Below, I’ll give you the name, walk you through the case, and show you exactly how I’d buy it.